Energy as the New Moat in AI Infrastructure
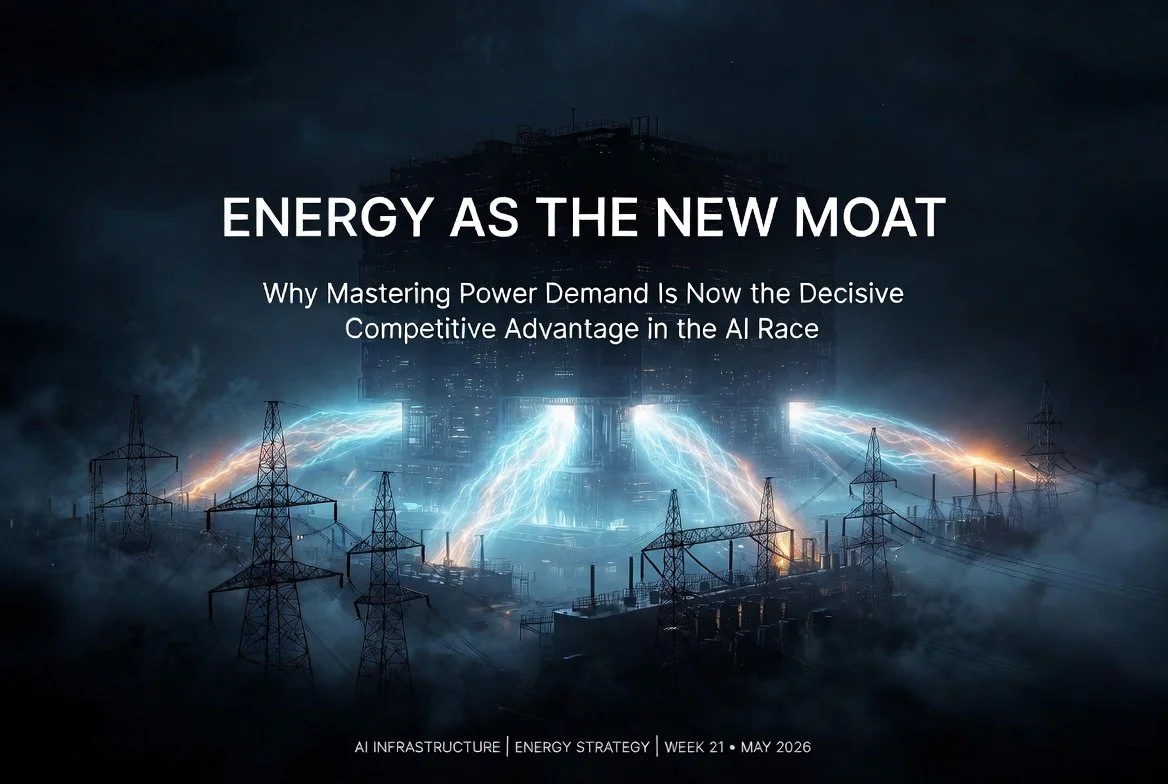
ENERGY DOMINANCE SERIES · WEEK 21 · PART I
Why Mastering Power Demand Is Now the Decisive Competitive Advantage in the AI Race
AI INFRASTRUCTURE | ENERGY STRATEGY | JUNE 2026
The AI race is no longer decided in server halls, it is decided at the substation. Power availability has overtaken chips and capital as the primary constraint on AI scaling, and the companies that treat energy as a core strategic asset are now pulling irreversibly ahead. This is not an infrastructure problem. It is a leadership problem dressed in kilowatts.
EXECUTIVE SUMMARY
From Bottleneck to Battlefield
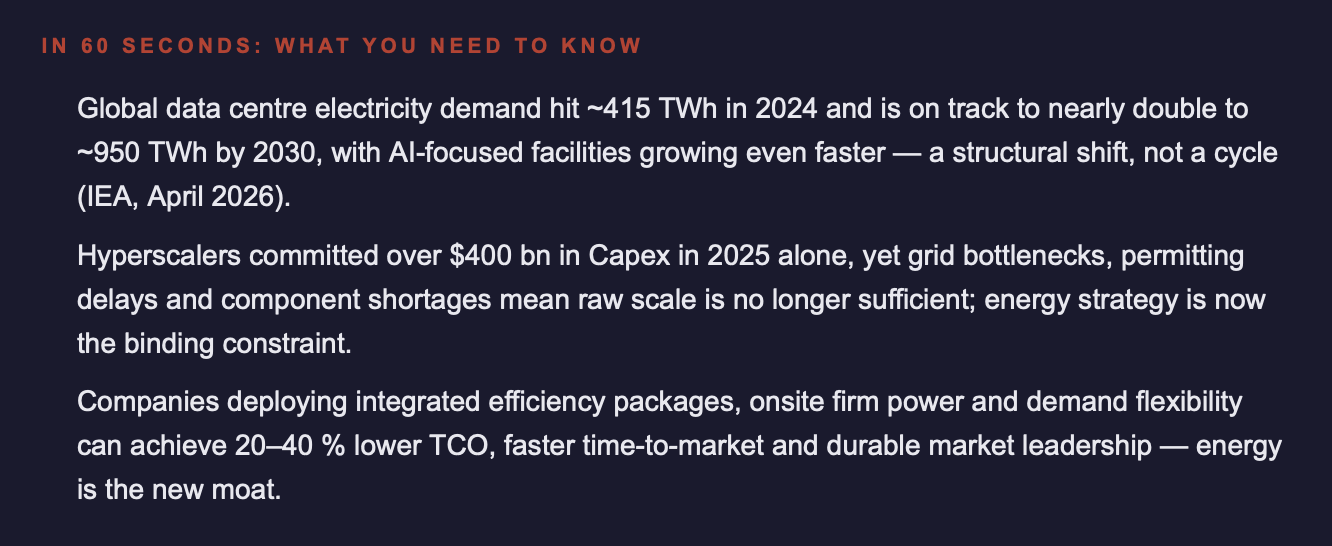
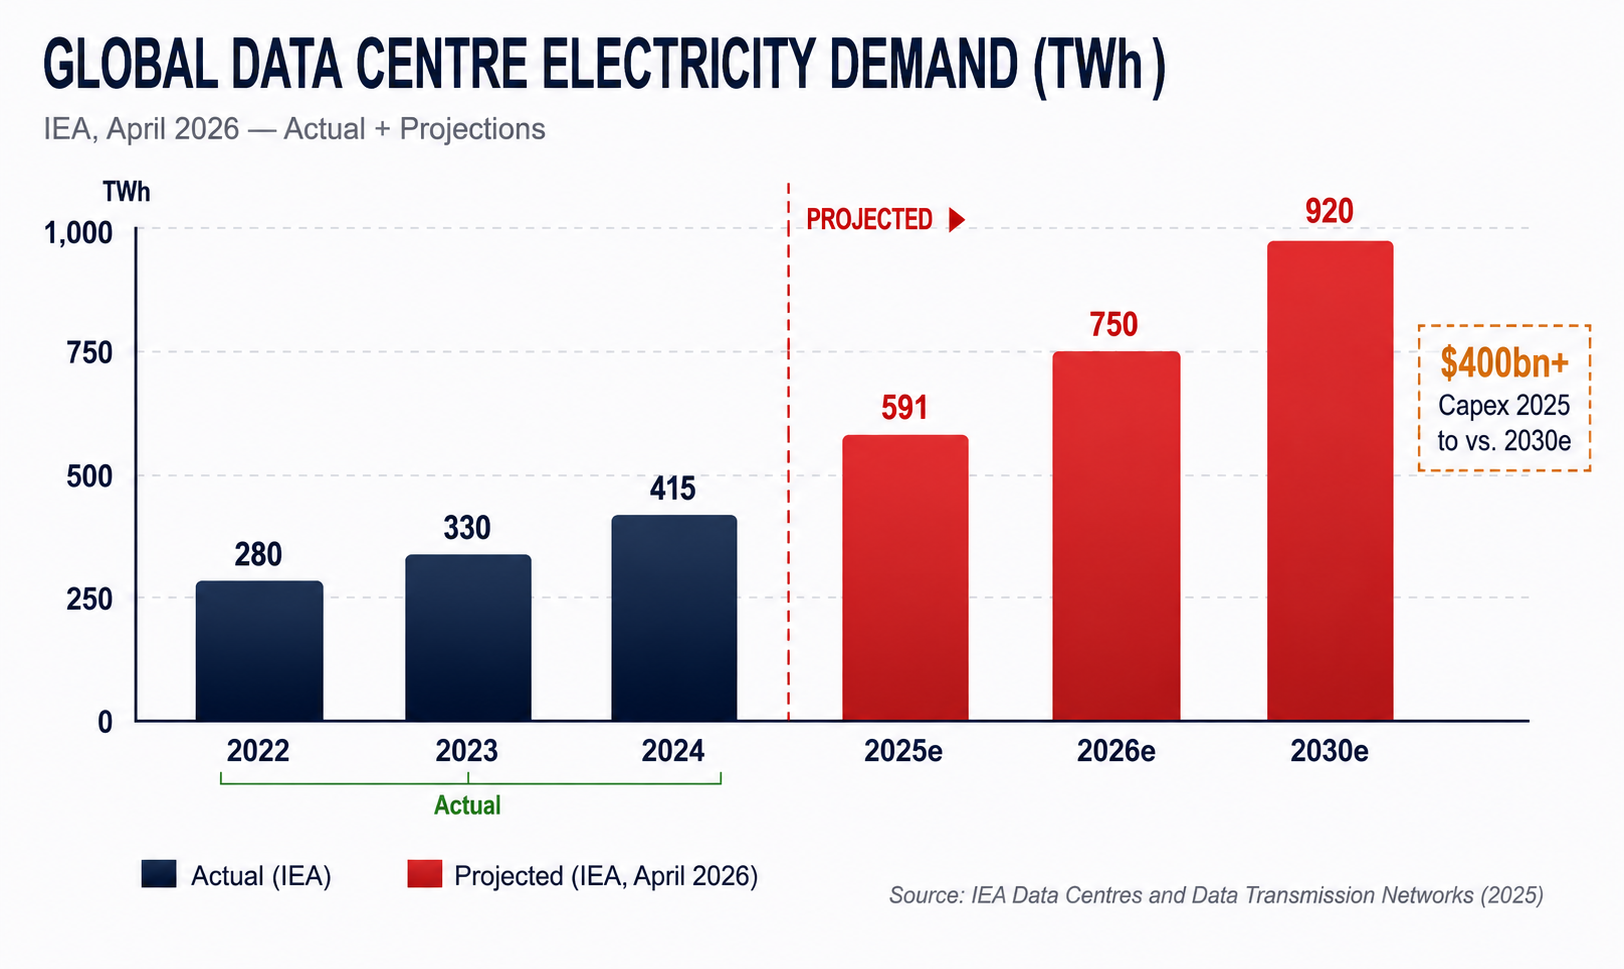
For most of the past decade, data centre operators treated power procurement as a facilities task, something managed below the CFO line. That paradigm is structurally broken. A single hyperscale AI campus now demands 1–5 GW of firm, continuous power, equivalent to the electricity consumption of a mid-sized city. The IEA confirmed in April 2026 that data centre electricity demand surged 17 % in 2025, with AI workloads driving disproportionate growth. By 2030, the sector is on track to consume nearly 950 TWh annually, roughly doubling from today's 415 TWh baseline.
The consequence is structural scarcity: grid interconnection queues in the US, UK and Germany now run 4–7 years. Projects without secured, reliable energy face delays, stranded Capex and competitive displacement. Chips and capital remain important, but energy has become the primary rate-limiter on AI deployment speed. Countries and companies with secure, affordable and rapid access to electricity are pulling ahead. Those without it are not simply slower. They are falling out of the race entirely.
In 2026, the winners will not be those who buy the most GPUs, but those who control the electrons that power them.
How Energy Creates True Competitive Advantage
The critical distinction is between operators who procure energy and those who architect it. Procurement is reactive: lock in a PPA, connect to the grid, and hope for stable prices and available capacity. Architecture is strategic: design the entire energy system, demand, generation, storage and flexibility, as an integrated competitive weapon.
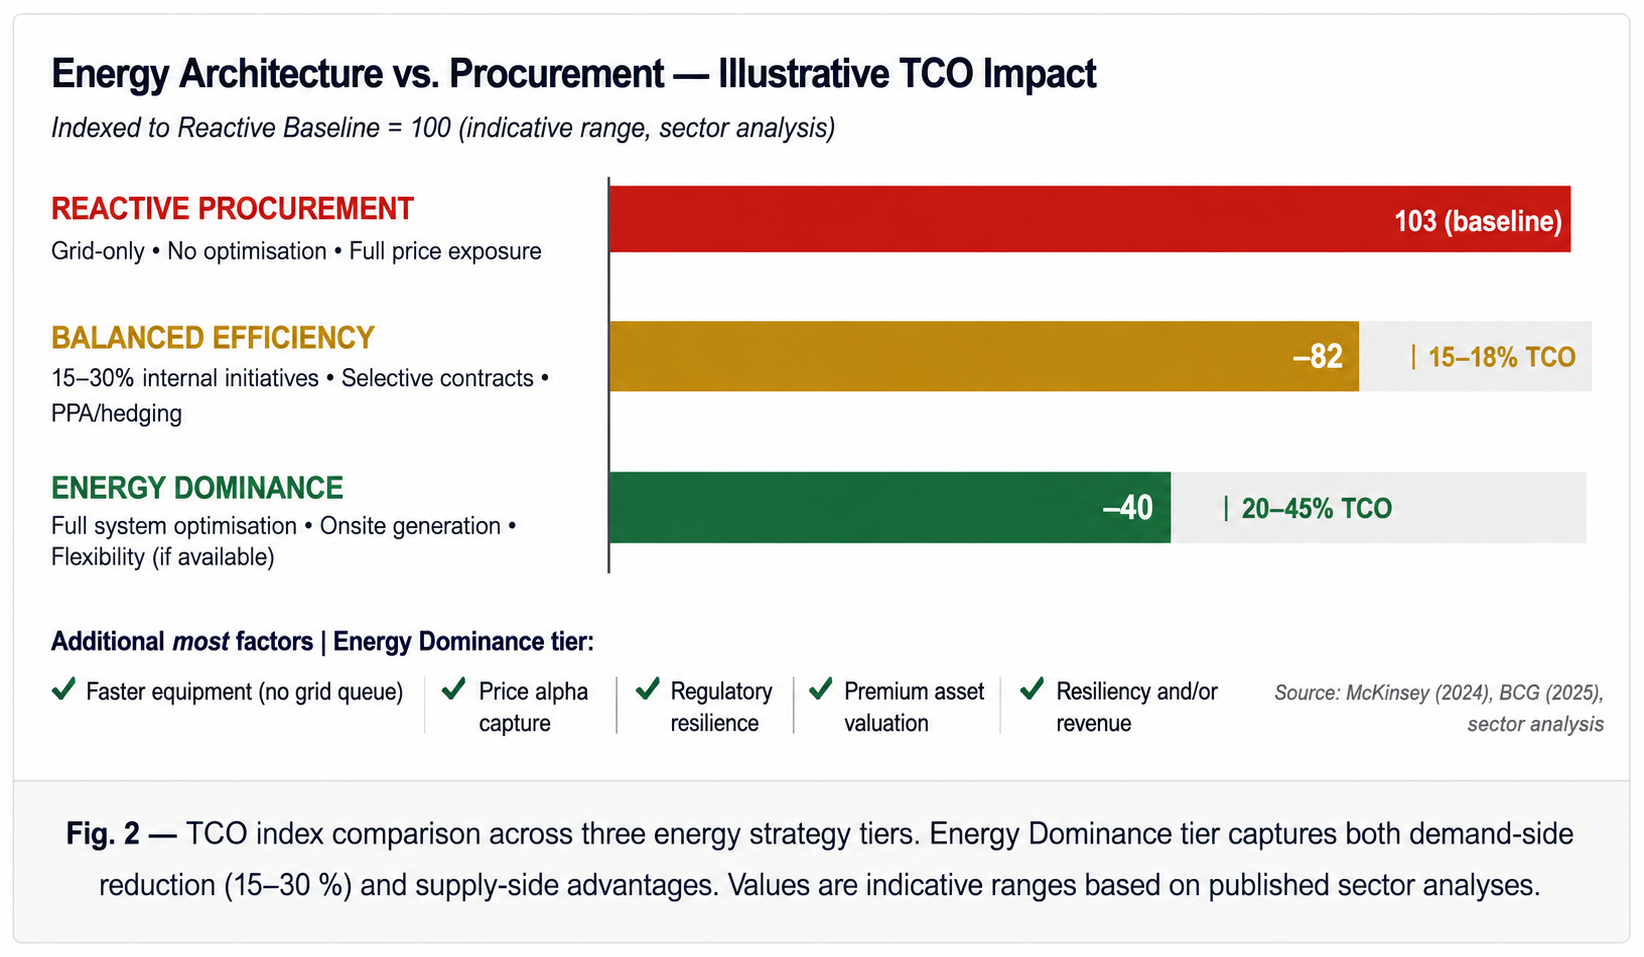
Leading operators have demonstrated this in practice. Integrated efficiency packages, combining liquid cooling, variable-frequency drive (VFD) systems and high-efficiency power delivery, can reduce absolute energy demand by 15–30 % before a single watt of generation is contracted. Onsite firm power (nuclear restarts, fuel cells, gas turbines with CCS) eliminates grid queue exposure entirely. Waste-heat recovery and demand-response programmes transform the facility from an energy consumer into a grid asset, capable of generating revenue from flexibility markets and reducing net energy cost further.
Procurement secures a commodity. Architecture secures a moat. The difference is not measured in cents per kWh, it is measured in deployment years gained or lost.
Quantified Scenarios for 2026–2030
The strategic divergence between operators is not theoretical, it is quantifiable. Three distinct trajectories have emerged across the sector, each with materially different outcomes for TCO, deployment timeline, regulatory exposure and capital efficiency. The scenario gap widens nonlinearly after 2027, as grid congestion intensifies and ETS-style carbon costs escalate in key markets.
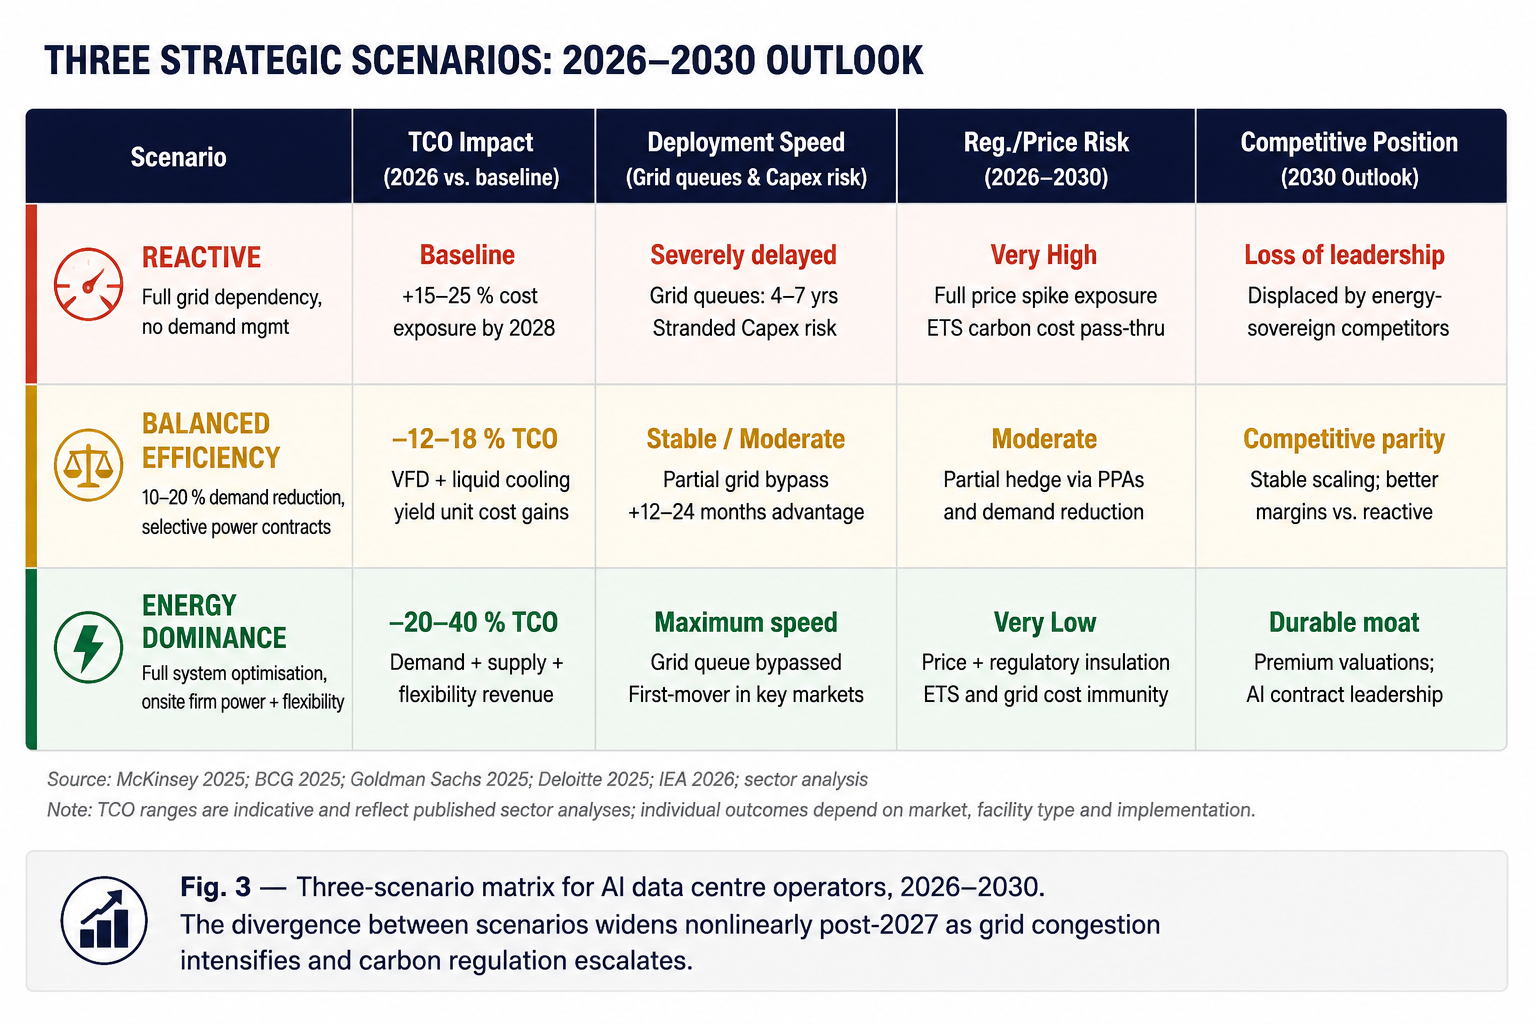
The scenario gap is not a planning exercise, it is already appearing in asset valuations, financing costs and contract win rates. The time to choose a trajectory is before the grid queue forms, not after.
CEO Action Plan: Energy as a Board-Level Moat
The transition from energy consumer to energy sovereign is a governance decision before it is an engineering one. Operators who continue to delegate power strategy to facilities management or procurement teams are systematically underweighting the asset with the highest leverage on their competitive position. The structural change required has four sequential dimensions.
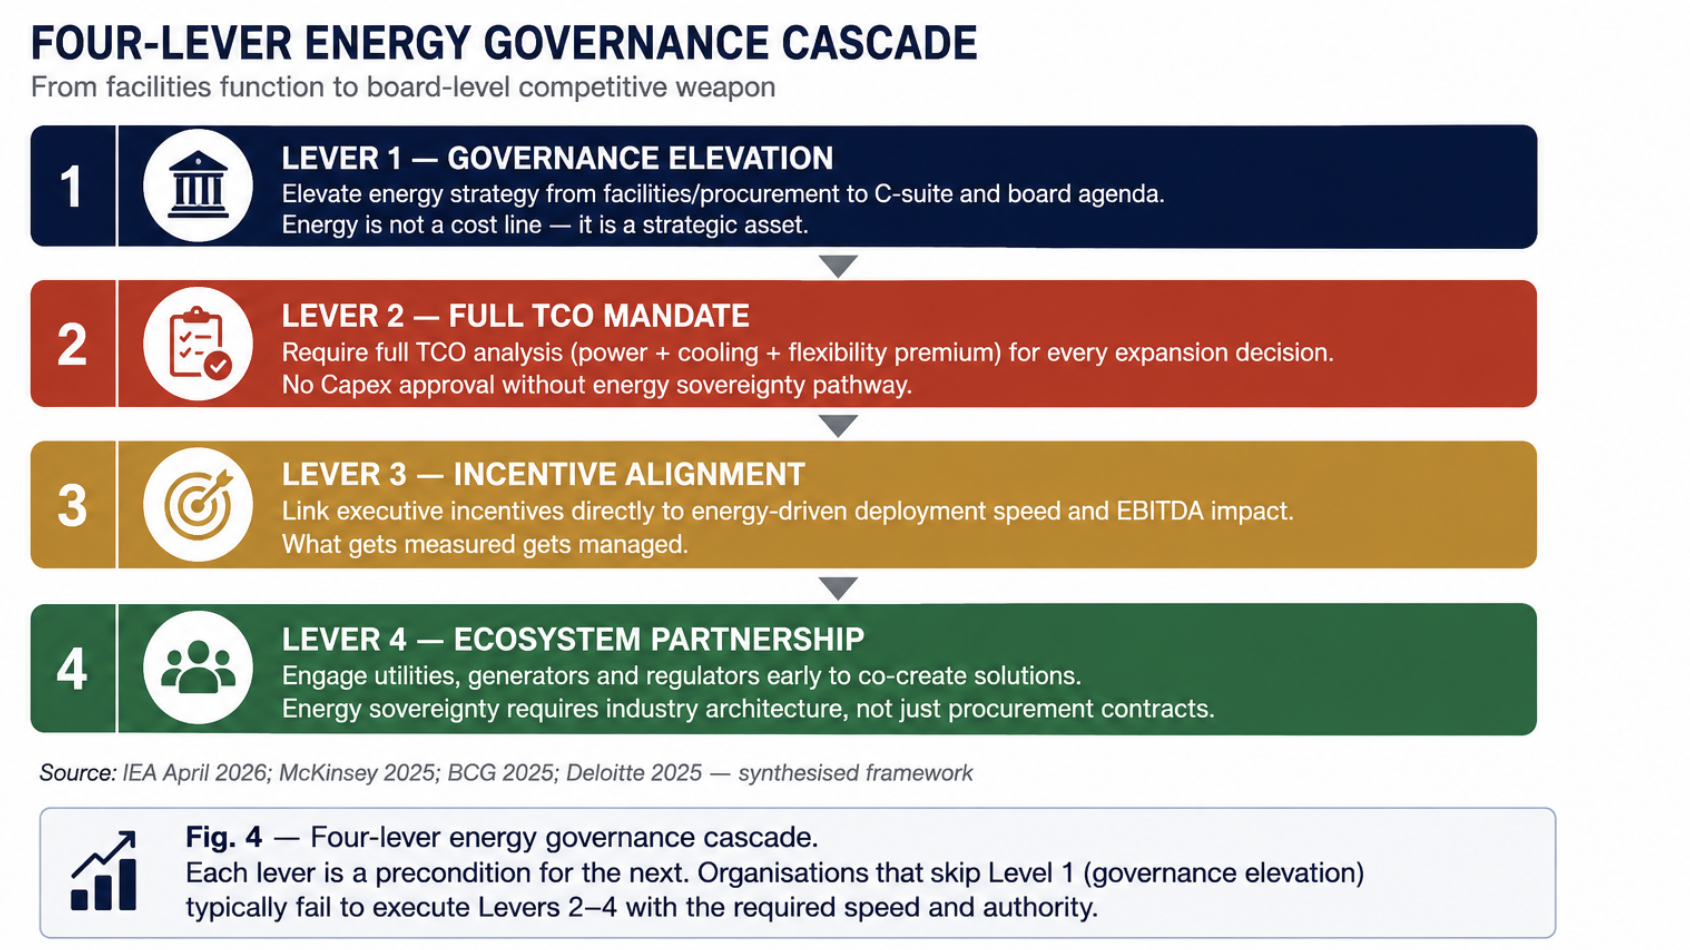
Energy strategy executed at the procurement level produces energy savings. Energy strategy executed at the board level produces competitive moats. The difference is who sits in the room when the decision is made.
Action Recommendations
IMMEDIATE ACTIONS: THIS WEEK
Commission a full energy sovereignty audit: map current grid dependencies, queue positions, price exposure and efficiency gaps across every facility.
Initiate a board-level briefing on energy as a strategic asset, presenting the three-scenario matrix with TCO and deployment-speed implications.
Identify the highest-leverage efficiency interventions (VFD, liquid cooling, power delivery) for your three largest consuming facilities.
6–24 MONTH STRATEGIC COMMITMENTS
Develop an integrated energy architecture plan: demand reduction targets (15–30 %), firm power pathways and demand flexibility revenue streams.
Establish early-stage partnerships with utilities, independent power producers and regulators to co-develop grid bypass or onsite generation solutions.
Restructure executive incentives to include energy-driven deployment velocity and EBITDA efficiency as explicit performance metrics.
Require full TCO including power, cooling and flexibility premium for all Capex approval processes from Q3 2026 forward.
LEADERSHIP CHECKLIST: ENERGY SOVEREIGNTY
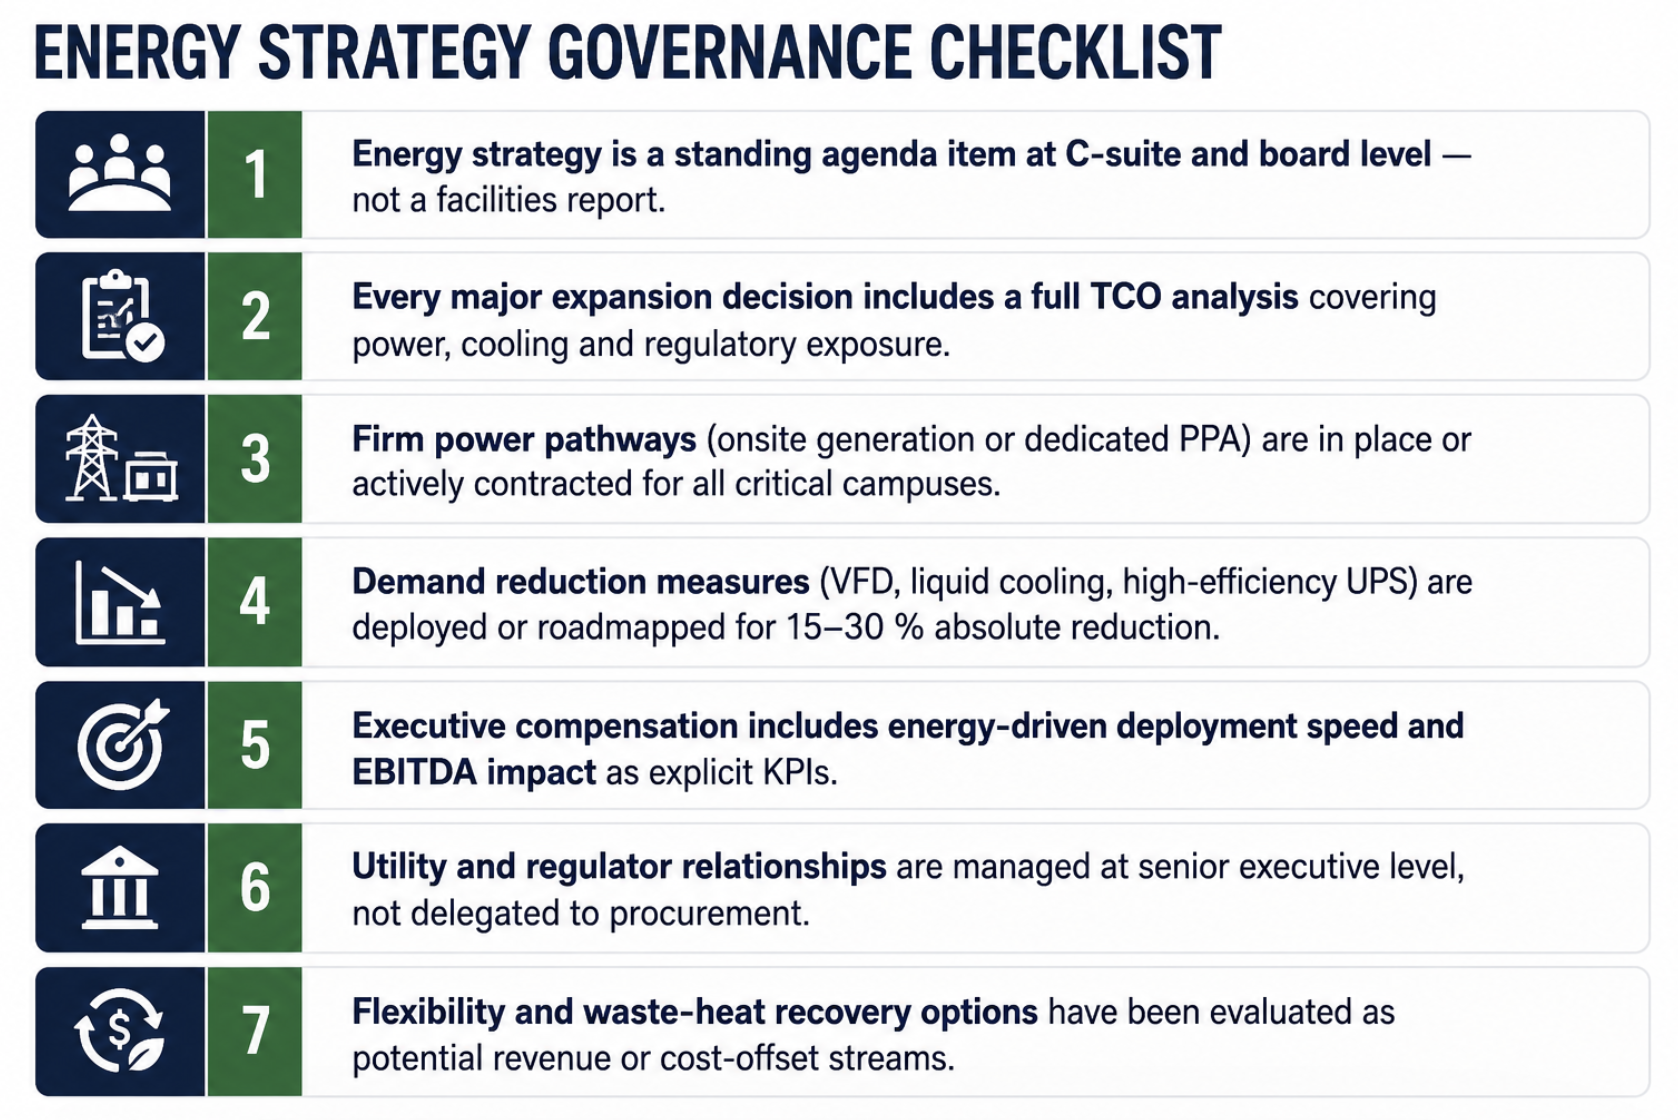
The AI race is settled at the substation, not the GPU rack. Every organisation that treats energy as a constraint to be managed will eventually be outpaced by one that treats it as a weapon to be wielded. The decision is not technical, it is a leadership choice that determines whether your organisation leads the next decade of AI infrastructure or funds it for someone else.
Energy Dominance Series-Week 21, Part I.
Part II explores the specific implementation mechanics of integrated efficiency packages and firm power pathways, with quantified deployment case studies and procurement frameworks.
Take the Next Step
Subscribe to the Weekly Punch for weekly strategic clarity, direct to your inbox.
REFERENCES
BCG (2025). Breaking Barriers to Data Center Growth. Boston Consulting Group. Available at: bcg.com [Accessed May 2026].
Deloitte (2025). Can US Infrastructure Keep Up with the AI Economy? Deloitte Insights, June 2025. Available at: deloitte.com [Accessed May 2026].
Goldman Sachs (2025). AI Power Demand Analyses. Goldman Sachs Global Investment Research, 2025. Available at: goldmansachs.com [Accessed May 2026].
IEA (2026a). Data Centre Electricity Use Surged in 2025. International Energy Agency, April 2026. Available at: iea.org [Accessed May 2026].
IEA (2026b). Key Questions on Energy and AI. International Energy Agency, April 2026. Available at: iea.org [Accessed May 2026].
McKinsey & Company (2025). The Cost of Compute: A $7 Trillion Race to Scale Data Centers. McKinsey Global Institute, 2025. Available at: mckinsey.com [Accessed May 2026].
Note: This article reflects my personalviews based on industry experience and publicly available information. It does not constitute professional, legal, or investment advice and does not represent the views of my employer.
