Energy Prices as a Strategic Risk in Shipping
STRATEGIC INTELLIGENCE BRIEF · WEEK 16, PART II · ENERGY RISK MANAGEMENT · APRIL 2026
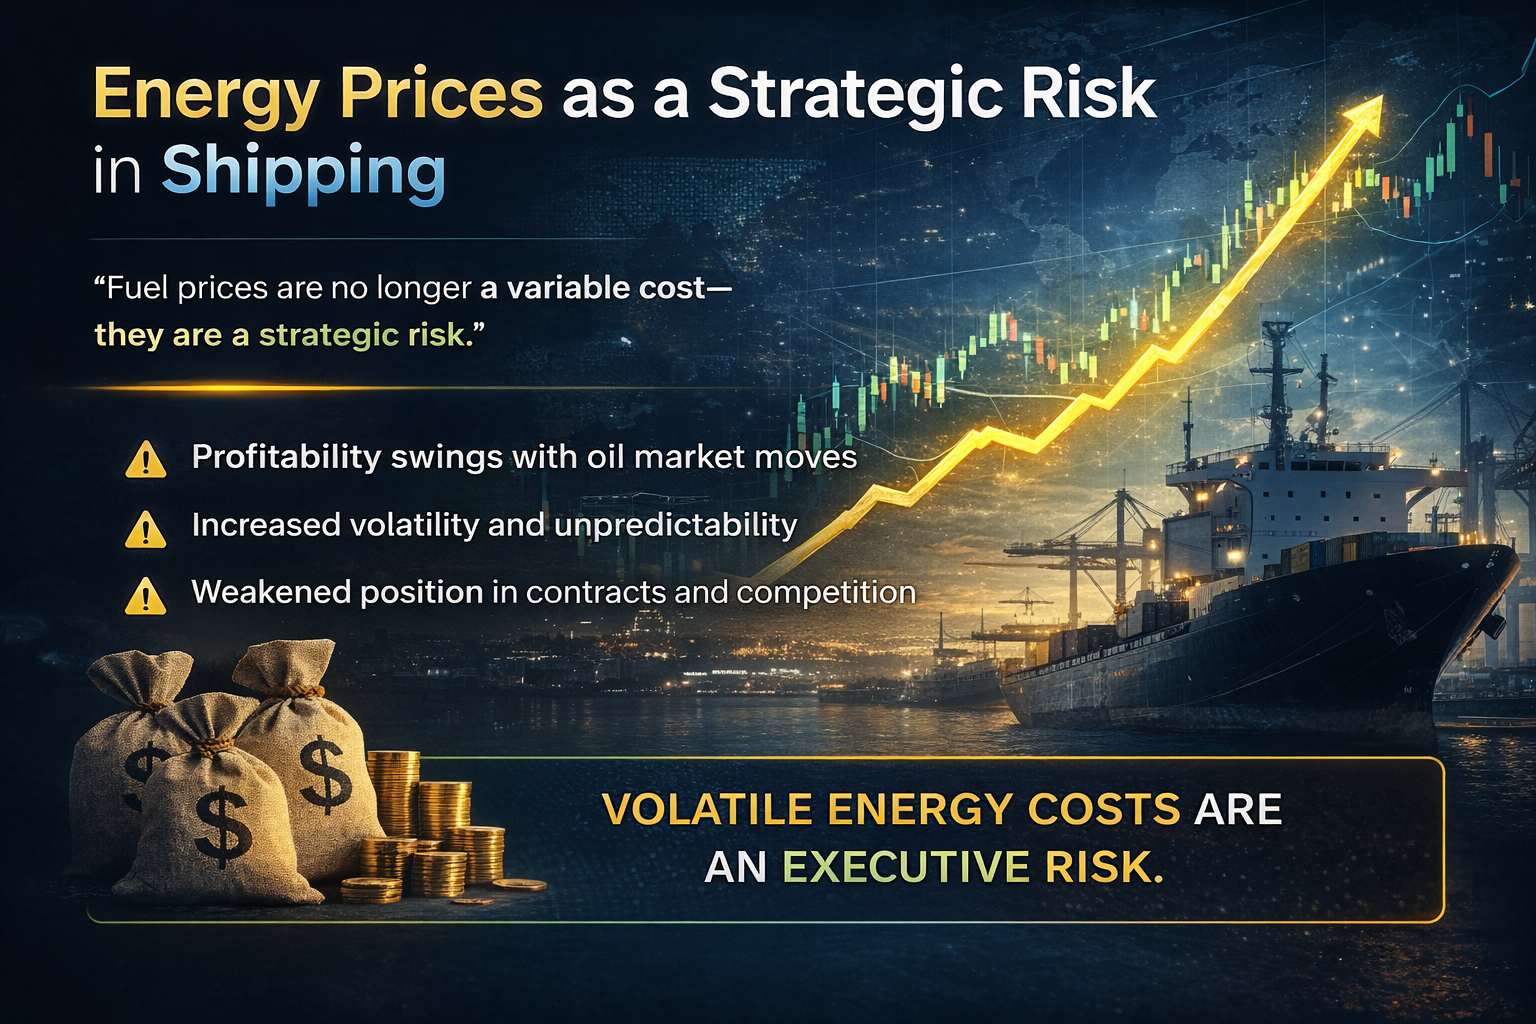
Why Bunker Volatility Is No Longer an Operating-Cost Issue, It's a Board-Level Strategic Threat
Maritime Industry | Energy Risk Management | CEO Perspective | René Grywnow, DBA
A bunker price spike of USD 174 per metric tonne in a single month is not a procurement problem. It is a strategic event, one that reroutes capital, breaks hedge structures, and separates fleet operators into two groups: those who had physical efficiency in place before the spike, and those who did not. The gap between those two groups will define commercial performance for the rest of the decade.
EXECUTIVE SUMMARY
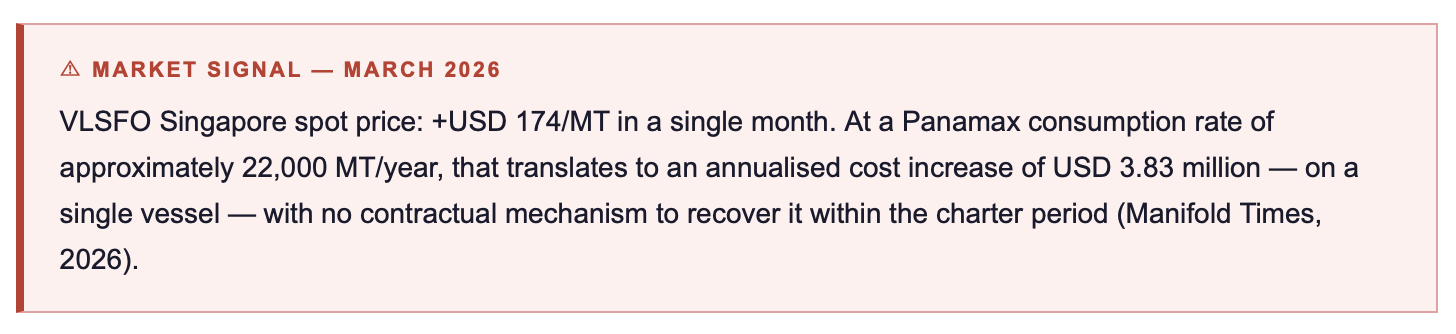
Geopolitical shocks in 2025/2026 pushed VLSFO Singapore up USD 174/MT within March 2026 alone, a 25–50% price movement in weeks, not quarters. For a Panamax operator, a sustained USD 100/MT increase adds USD 2.0–2.5 million to annual OPEX with no contractual offset available (Manifold Times, 2026).
A 20% physical efficiency improvement, achievable today via proven drydock packages, delivers the equivalent of a permanent USD 100–150/MT bunker price discount, without counterparty risk, without commodity price dependency, and without infrastructure preconditions.
CEOs who still classify energy prices as a procurement or CFO-level topic are misclassifying a board-level strategic risk. Physical efficiency is the only hedge that functions across every geopolitical scenario, every bunker price trajectory, and every regulatory framework simultaneously.
1. The New Reality: Bunker Markets as Geopolitical Instruments
For most of the past two decades, bunker price volatility was a known and manageable operating variable. Procurement teams hedged forward positions, CFOs built price corridors into charter model assumptions, and price swings of 15–20% over a quarter were absorbed through contract mechanisms, fuel clauses, and balance sheet buffers. That model has broken down.
The Middle East tensions that intensified through late 2024 and into 2026, combined with Strait of Hormuz threat scenarios and continuously shifting OPEC+ output policy, have introduced a structural regime change. Bunker prices are no longer moving on supply-demand fundamentals alone, they are moving on geopolitical calendars. The March 2026 VLSFO spike of USD 174/MT in Singapore did not emerge from a tightening physical market. It emerged from a combination of regional security escalation and speculative positioning that no financial hedge could have fully anticipated.
Lloyd's List Shipping Podcast episodes from Q1 2026 have repeatedly emphasised a theme that would have seemed hyperbolic three years ago: decarbonisation is now a commercial reality that directly affects fixing, operating, and trading strategies. The link between energy price risk and commercial positioning is no longer theoretical. It is visible in fixture books, in charter rate differentials between CII-rated vessels, and in the lending terms offered by Poseidon Principles signatories. What began as a regulatory compliance conversation has become a strategic risk management imperative, and bunker price volatility is the mechanism that made it so.
The International Energy Agency's 2025 shipping energy commentary confirmed what operational data had already suggested: vessels with documented energy efficiency improvements are demonstrably less exposed to bunker price shocks across the full range of geopolitical scenarios. The mechanism is straightforward, lower consumption volume means lower exposure to price movements, regardless of their origin.
👉 Key Insight: Energy price risk has moved from the CFO's spreadsheet to the CEO's strategy session. The decision is no longer whether to manage bunker price exposure, it is whether to manage it reactively, through financial instruments that fail precisely when they are most needed, or proactively, through physical efficiency that reduces consumption volume permanently.
2. Quantifying the Exposure: What Bunker Volatility Actually Costs
Fuel represents 50–60% of vessel OPEX across most commercial segments. At that share, bunker price movements are not a line item, they are the dominant driver of operating profitability. The following matrix makes the exposure concrete across three vessel classes and four price scenarios, including the March 2026 shock level.
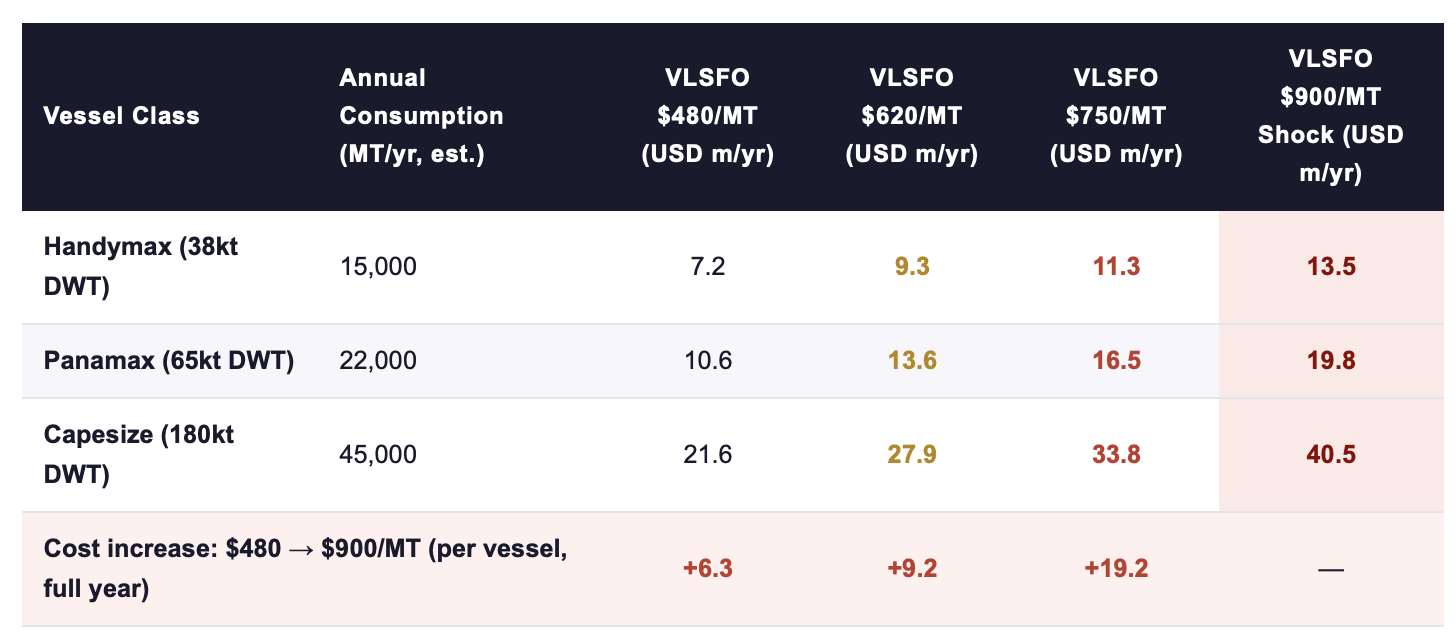
Consumption estimates based on IMO GHG Study 2020 vessel class benchmarks; price scenarios reflect observed 2025/2026 market range. Shock scenario ($900/MT) reflects plausible Hormuz closure trajectory (IEA, 2025).
Three patterns in this matrix deserve CEO-level attention. First, the absolute cost difference between an adverse and a shock scenario is not marginal, for a Panamax fleet of ten vessels, the difference between operating at USD 620/MT and USD 900/MT is USD 62 million per year in additional fuel spend. That is not recoverable from operational efficiencies elsewhere in the business.
Second, the shock scenario column is not a stress test hypothetical. The March 2026 spike trajectory, extrapolated forward under a sustained Hormuz restriction scenario, produces price levels in this range within a matter of months. IEA (2025) shipping commentary specifically models this scenario.
Third, and this is the core strategic point, a 20% reduction in consumption volume permanently shifts the vessel to a lower row in this cost structure, regardless of which price column is active. The following table shows what that equivalence looks like:
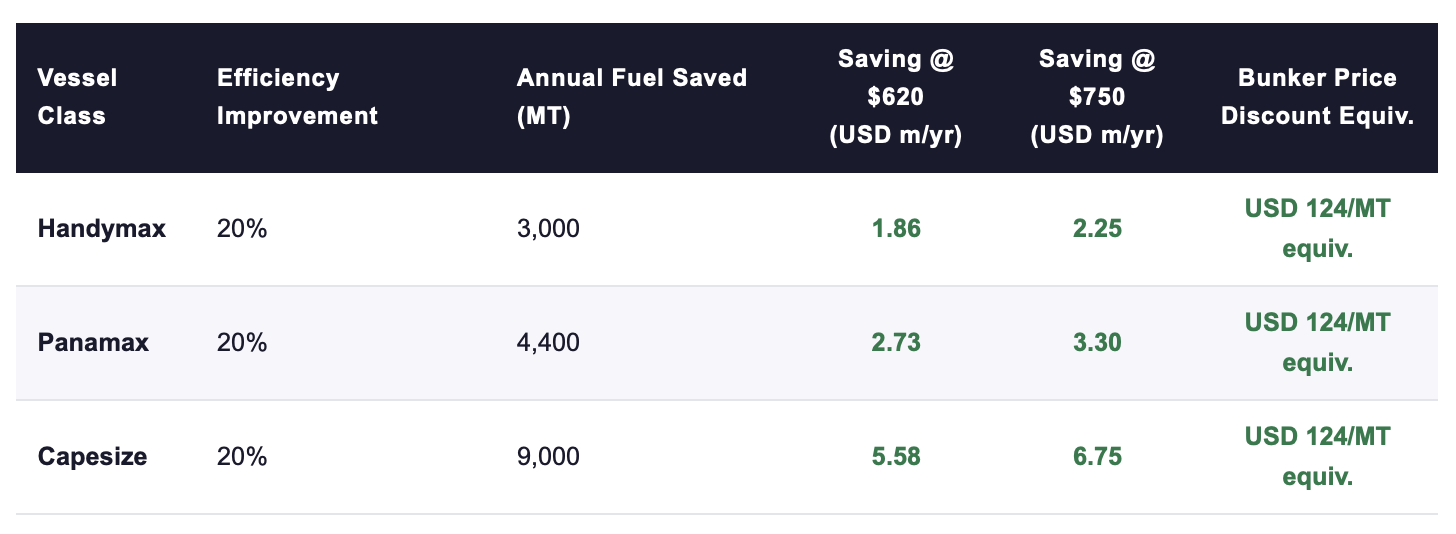
Efficiency improvement via combined drydock package (hull coating + propeller + IE4/IE5 pumps + VFD). Bunker discount equivalent: annual saving divided by baseline annual consumption. Sources: ABS, 2026; Wärtsilä, 2026.
The bunker price discount equivalence, approximately USD 124/MT at a 20% efficiency improvement, means that an operator who has completed a combined drydock retrofit is structurally insulated from the first USD 124/MT of any future price spike. At the March 2026 spike magnitude of USD 174/MT, that insulation covers 71% of the shock. No financial hedge instrument currently available in the marine bunker market offers this combination of certainty, duration, and scenario independence.
👉 Key Insight: A 20% physical efficiency improvement is not a green investment, it is a USD 124/MT permanent discount on every tonne of bunker the vessel will ever consume. It is the only hedge that gains value as price volatility increases, requires no counterparty, and cannot be unwound by a market dislocation.
3. The CEO Playbook: From Reactive to Strategic Energy Risk Management
The three imperatives below are not aspirational principles, they are operational positions that separate the companies gaining competitive separation in 2026 from those managing emergencies. Each has a specific mechanism, an empirical basis, and a decision consequence.
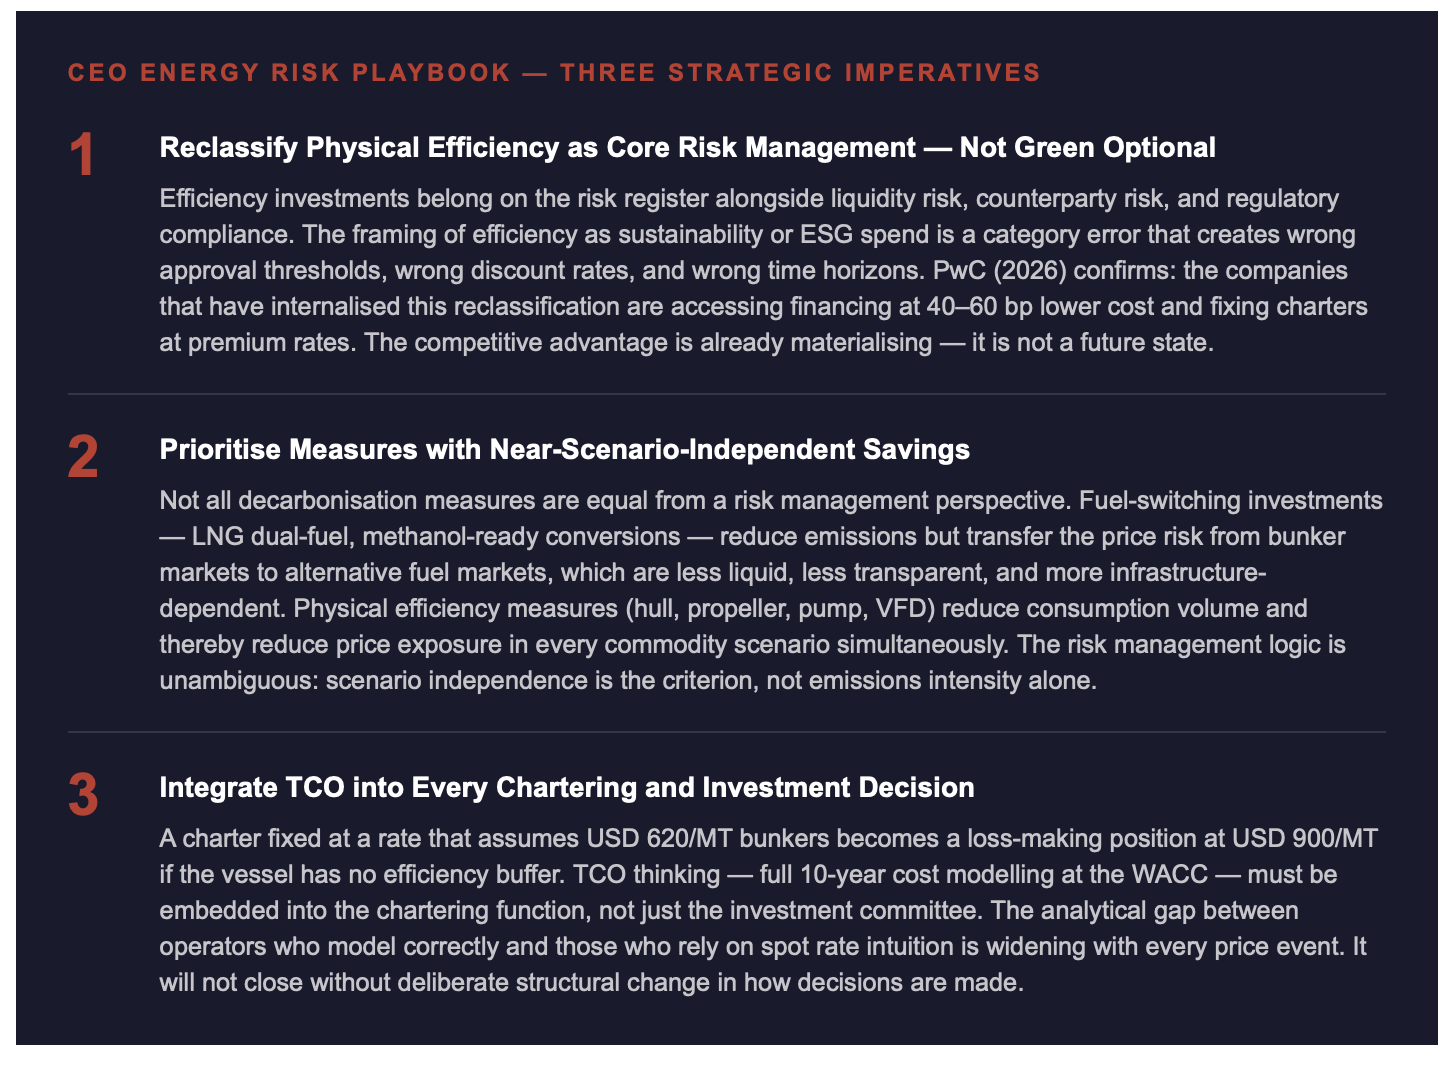
Nature Sustainability (2025) provides the empirical foundation for this playbook: across vessel classes and trade routes, the companies that achieved the highest total return on capital during the 2022–2025 volatility cycle were not those with the best financial hedges, they were those with the lowest fuel intensity per tonne-mile. Physical efficiency was the differentiating variable. Financial sophistication was table stakes.
👉 Key Insight: The strategic question is not "how do we hedge bunker prices?", that question accepts volatility as a permanent external condition. The strategic question is "how do we reduce the volume on which volatility acts?" Physical efficiency is the answer. Every other instrument manages the symptom; efficiency eliminates a portion of the exposure permanently.
4. The Multiplier Effect: How Efficiency Gains Compound Over Time
The annual savings figures in Section 2 understate the strategic value of efficiency improvements because they do not capture the compounding dynamic. An efficiency gain secured in Year 1 protects the vessel against every subsequent price event, and the value of that protection increases with each spike, not decreases. This is the inverse of most financial hedges, which decay in value or require continuous renewal at market rates.
The chart below models cumulative 10-year fuel cost savings for a Panamax vessel with a 20% efficiency improvement across four bunker price scenarios. No discounting is applied, the figures represent gross cash flow protected from price exposure.
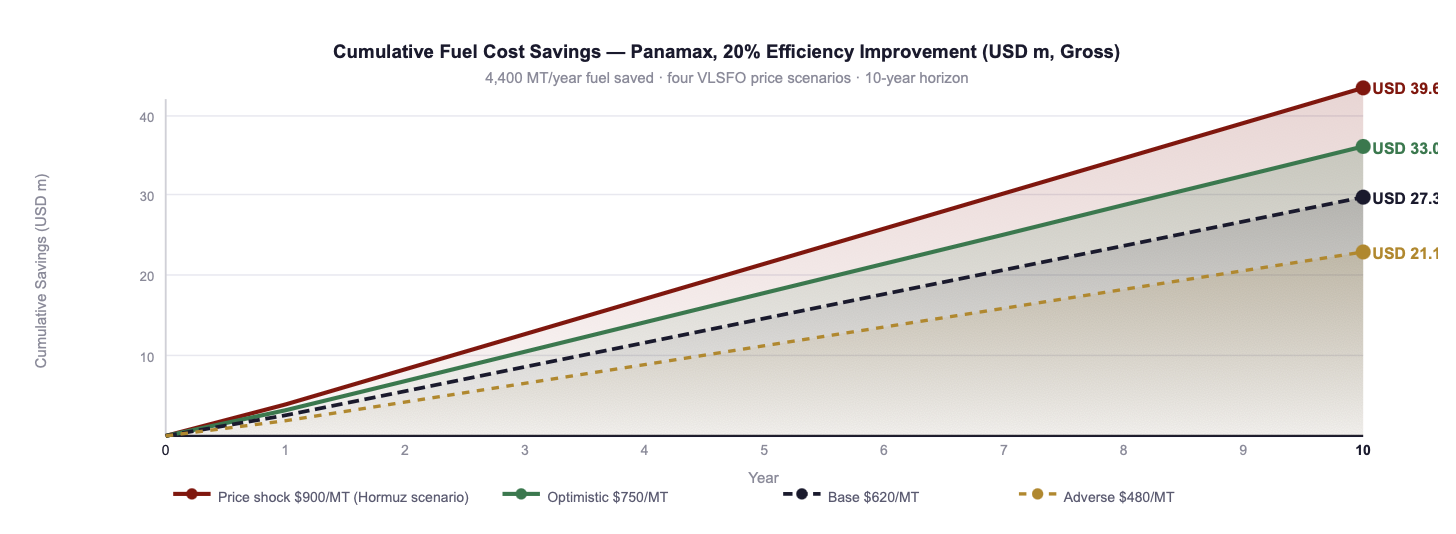
Fig. 1: Cumulative gross fuel cost savings, Panamax vessel, 20% efficiency improvement (4,400 MT/yr saved). No discounting applied. Higher price scenarios amplify saving proportionally, efficiency gains accelerate in value with every future spike. Sources: ABS, 2026; Wärtsilä, 2026; own modelling.
Three features of this chart are strategically significant. First, the gap between scenarios widens with every passing year, efficiency installed in Year 1 generates compounding protection, not linear protection. Second, the shock scenario line reaches USD 39.6 million in cumulative savings over ten years for a single Panamax, approximately eight times the combined drydock retrofit Capex. Third, even in the adverse scenario, cumulative savings reach USD 21.1 million, a return profile that no financial hedge instrument could match over the same horizon.
The multiplier operates on two axes simultaneously. First, within the bunker cost structure: every percentage point of efficiency improvement eliminates that percentage of price exposure permanently. Second, across the regulatory cost stack: CII rating improvements reduce EU ETS compliance costs and preserve access to progressive charter markets. These are additive, not alternative, value streams from the same physical investment.
👉 Key Insight: Efficiency gains do not depreciate as bunker prices rise, they appreciate. The more volatile the price environment, the more valuable each tonne of consumption eliminated. This is the inverse of every financial hedge structure, which becomes more expensive precisely when it is most needed. Physical efficiency is the only instrument that gains strategic value with market instability.
5. The Two-Tier Market: Why Energy Risk Management Is Now a Competitive Advantage
The commercial consequence of what has been described above is already visible in fixture markets and lending terms. It is not a future scenario, it is a present bifurcation that will widen through 2026 and into 2027.
Vessels with documented efficiency profiles and positive CII trajectories are fixing at rate premiums that persist across market cycles. The mechanism is not charterer goodwill, it is charterer risk management. Cargo owners operating under SBTi commitments and scope 3 reporting obligations are embedding vessel emissions performance into fixture selection criteria. A vessel that cannot demonstrate a CII improvement pathway is not competitive for those cargoes, regardless of freight rate. As SBTi adoption among major cargo owners accelerates, currently covering over 40% of global container volumes and growing rapidly in dry bulk, the exclusion mechanism becomes progressively more structural.
On the financing side, the Poseidon Principles framework has created a two-tier lending market in which the spread differential between eligible and non-eligible projects is not static. PwC (2026) documents the current 40–60 basis point advantage for qualifying efficiency retrofit projects, but notes that this spread reflects the early-mover premium. As more efficiency projects enter the eligible pool, the premium will compress; simultaneously, the cost of financing non-compliant assets will rise as lenders face their own alignment reporting obligations. The window for capturing the maximum spread advantage is open now.
The Lloyd's List Shipping Podcast assessment from Q1 2026 captures the inflection point precisely: the conversation has shifted from "whether to act" to "whether you acted early enough." CEOs who treated energy efficiency as a compliance cost through 2024 are now managing a competitive disadvantage. Those who treated it as a strategic risk management investment are operating with structurally lower cost bases, better charter books, and cheaper capital, simultaneously.
👉 Key Insight: The two-tier market is not forming, it has formed. Vessels with physical efficiency improvements and documented CII trajectories are in Tier 1: lower financing costs, better charter access, structural insulation from price spikes. Vessels without them are in Tier 2: competing on spot rates in a narrowing pool, exposed to every geopolitical event, and facing rising capital costs. The migration from Tier 2 to Tier 1 requires a drydock window and a decision. It does not require a new vessel.
ACTION RECOMMENDATIONS
IMMEDIATE MEASURES (0–90 DAYS)
Calculate your fleet's annualised bunker cost exposure at USD 750/MT and USD 900/MT, present both figures to the board alongside the current OPEX budget to establish the energy risk quantification baseline.
Commission an efficiency audit for every vessel scheduled for drydock within the next 18 months, calculate the bunker price discount equivalent of achievable efficiency improvements before the drydock window is fixed.
Review all open charter negotiations and time-charter renewals for fuel clause adequacy, identify vessels with no efficiency buffer operating under fixed-rate arrangements that assumed sub-USD 650/MT bunker prices.
Engage at least one Poseidon Principles signatory lender to establish current green finance eligibility and spread advantage for your next efficiency retrofit project.
STRATEGIC COMMITMENTS (6–24 MONTHS)
Establish a board-level energy risk register, formalise bunker price exposure as a strategic risk item, not an operating cost line, with quarterly scenario modelling reviewed at board level.
Set fleet-wide efficiency targets expressed in bunker price discount equivalents, align the commercial, technical, and finance functions around this single metric to eliminate the ESG/operations silo that delays investment decisions.
Sequence your drydock programme to maximise the combined retrofit synergy window, hull coating, propeller optimisation, pump and motor upgrade, and VFD installation bundled in a single yard event delivers 20–35% better economics than sequential individual projects (see Week 2, Part I of this series).
Develop scenario playbooks for USD 750, USD 900, and USD 1,100/MT bunker price environments, with explicit vessel-level response protocols for chartering, routing, and speed management at each threshold.
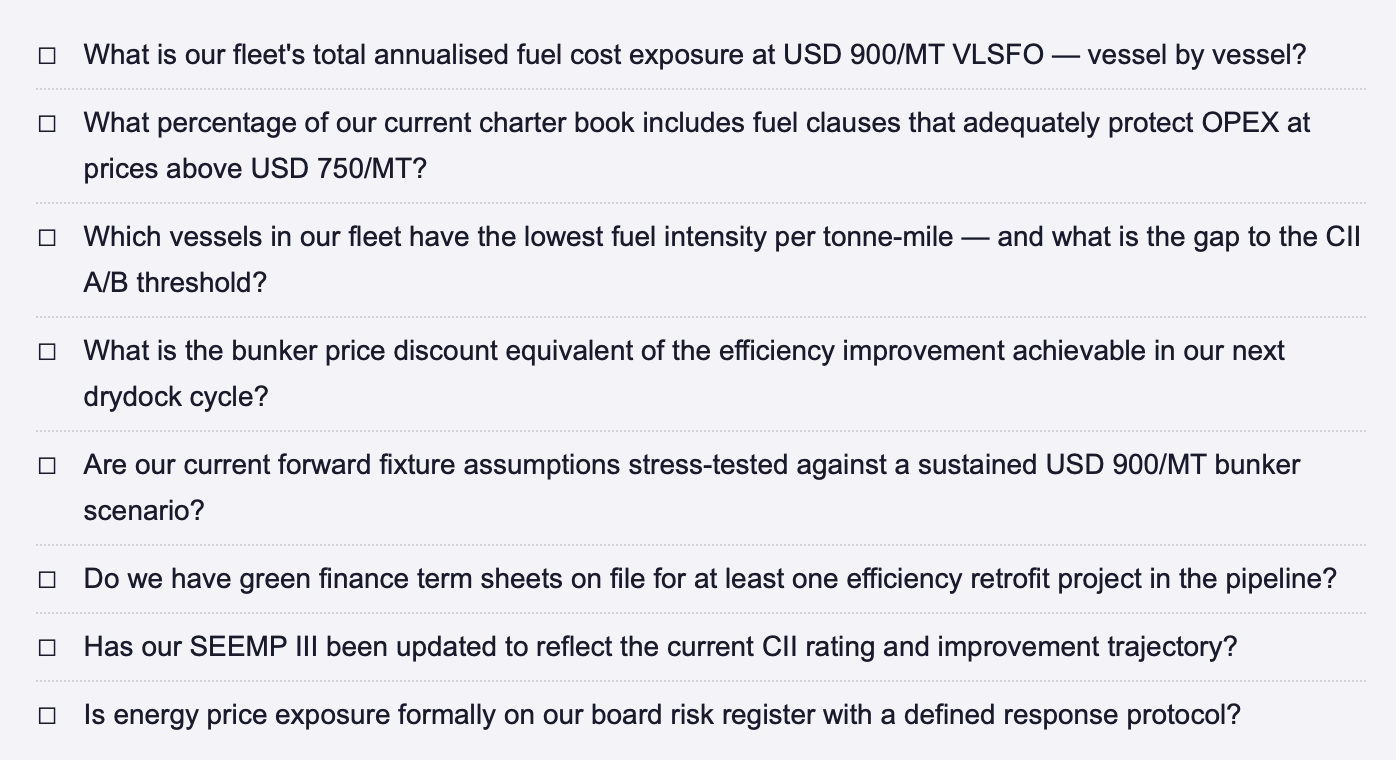
CEO ENERGY RISK CHECKLIST, QUESTIONS EVERY BOARD SHOULD BE ABLE TO ANSWER
FINAL THOUGHT
The March 2026 VLSFO spike of USD 174/MT made one thing unmistakably clear: the question of whether to manage energy price risk at the strategic level has been answered by the market, not by boardroom discretion. The only remaining question is the instrument. Financial hedges fail exactly when geopolitical shocks are large enough to matter. Fuel-switching bets transfer price risk to less liquid markets. Physical efficiency removes consumption volume from the exposure equation permanently, and gains value with every future price event rather than losing it. CEOs who have internalised this logic are not managing an energy risk problem. They have converted an energy risk into a competitive position. That is the only outcome worth building toward.
How has your organisation's approach to bunker price risk changed since the Q1 2026 volatility events, and at what point does energy price exposure formally enter your board agenda? Connect for a direct exchange or share your experience below. | This post is Part II of Week 16 in the Efficiency Before Fuel series, see Part I for the full TCO framework and investment decision methodology.
REFERENCES
ABS (American Bureau of Shipping) (2026) Retrofit Efficiency Reports: Lifecycle Cost Benchmarks for Mid-Size Bulk Carriers and Tankers. Houston: ABS.
IEA (International Energy Agency) (2025) Shipping Energy Savings Commentary: Scenario Analysis for Efficiency-Based Decarbonisation Pathways. Paris: IEA.
Lloyd's List (2026) Shipping Intelligence Podcast: Decarbonisation as Commercial Decision-Making. Episodes Q1 2026, March–April. London: Lloyd's List Intelligence.
Manifold Times (2026) 'VLSFO Singapore spot price volatility: March 2026 analysis', Manifold Times Bunker Intelligence, March 2026. Singapore: Manifold Times.
Nature Sustainability (2025) 'Comparative lifecycle performance of marine decarbonisation pathways: efficiency versus fuel substitution', Nature Sustainability, 8(3), pp. 214–229.
PwC (2026) Economics of Sustainable Shipping: Green Finance Eligibility, Spread Differentials, and Fleet-Level Risk Modelling. London: PricewaterhouseCoopers.
Poseidon Principles (2024) Annual Report: Portfolio Alignment and Financed Emissions 2024. New York: Poseidon Principles Secretariat.
Wärtsilä Corporation (2026) Lifecycle Optimisation Report: Total Cost of Ownership Analysis for Propulsion and Auxiliary Systems.Helsinki: Wärtsilä.
© René Grywnow, DBA · Strategic Intelligence Brief · April 2026Efficiency Before Fuel Series · Week 2, Part II