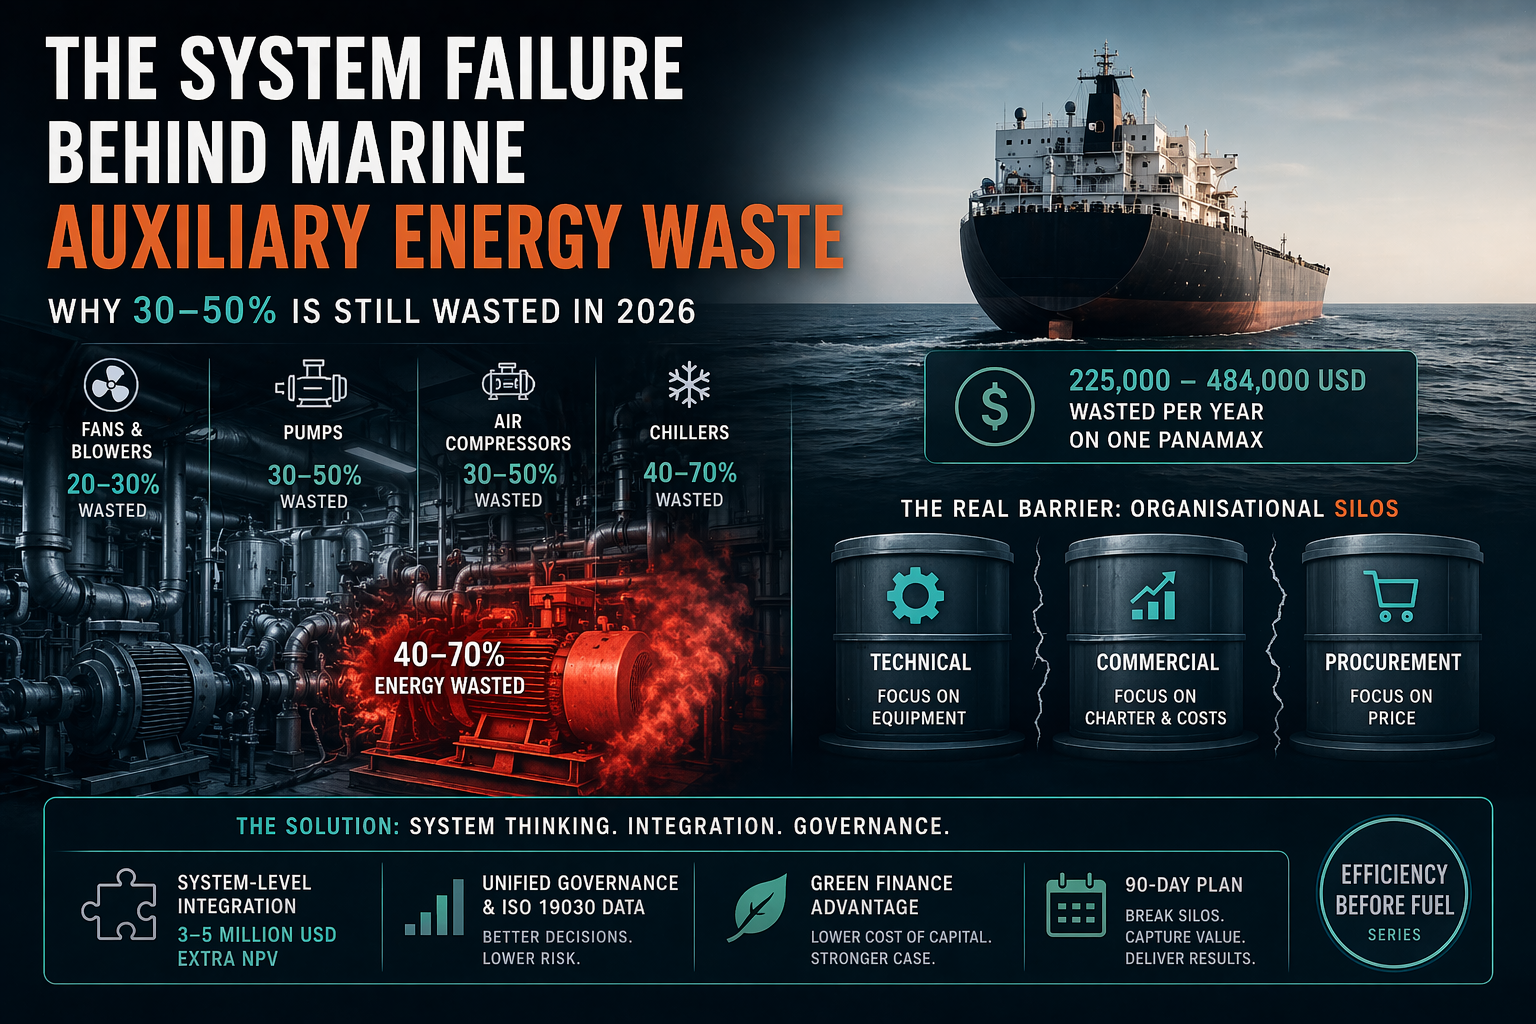
The System Failure Behind Marine Energy Waste
EFFICIENCY BEFORE FUEL · SERIES POST 13 · WEEK 17, PART III · APRIL 2026
Why 30–50% of Auxiliary Energy Is Still Wasted, and Why Siloed Thinking Is the Root Cause
Maritime Industry | System-Level Inefficiency | Strategic Intelligence Brief | René Grywnow, DBA
The technology to eliminate most marine energy waste already exists, is commercially available, and has been proven in thousands of installations. The reason it is not deployed more widely is not cost, not complexity, and not regulatory uncertainty. It is organisational. Departments that do not share data, KPIs that reward the wrong behaviour, and chartering structures that price speed over efficiency, these are the barriers. The system is failing, and the failure is structural.
EXECUTIVE SUMMARY
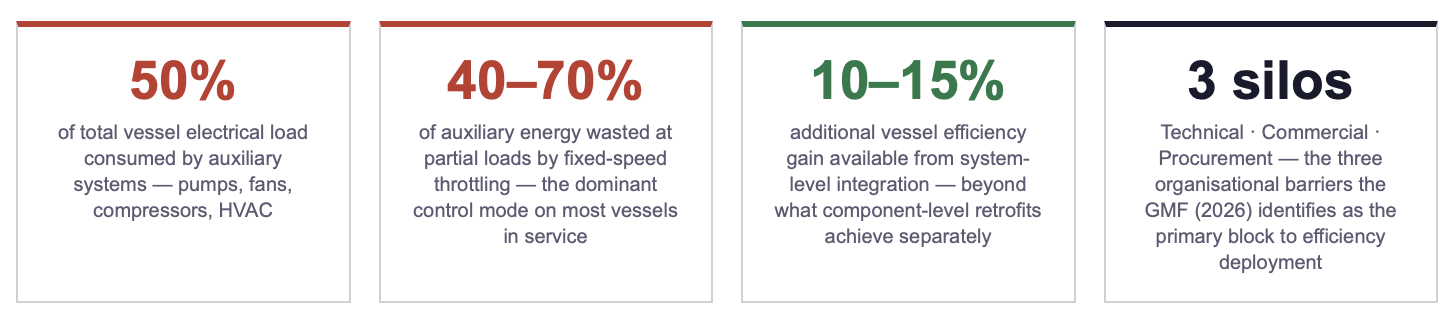
Auxiliary systems, pumps, fans, compressors, HVAC, consume up to 50% of a vessel's total electrical load. Fixed-speed throttling control wastes 40–70% of that energy at typical partial-load operating points. The University of Piraeus (2025) and ABS (2025) data confirm that this waste is not distributed across hundreds of small inefficiencies, it is concentrated in a small number of high-load systems that share a single root cause: they are run at full speed against a valve instead of being matched to actual demand.
The Global Maritime Forum's January 2026 report "Maritime operational efficiency hampered by leadership challenges" identifies the structural barrier with precision: efficiency improvements are being blocked by departmental silos, misaligned chartering incentives, and legacy KPIs, not by the absence of viable technology. The technology is ready. The organisation is not.
The fix is system-level, not component-level. Combining hull and propulsion optimisation with full auxiliary system integration (IE4/IE5 motors + VFDs across all major pump and fan circuits) during a single drydock event delivers 10–15% additional efficiency gains beyond what individual component retrofits achieve in isolation, through inter-system optimisation that siloed maintenance cannot capture.
1. Mapping the Hidden Waste: Where the Energy Goes
The energy waste documented in the previous post on pump systems (Week 2, Part IV) is not confined to ballast pumps and seawater cooling circuits. It extends across the entire auxiliary system architecture of a typical commercial vessel, and the pattern is consistent: wherever a fixed-speed motor drives a centrifugal load controlled by a throttling valve, the Affinity Laws guarantee that a large fraction of the input energy is converted to heat and pressure drop rather than useful work.
The following table maps the waste across a Panamax auxiliary system, system by system, to make the total visible before the organisational analysis. The data reflect University of Piraeus (2025) study parameters and ABS (2025) auxiliary system efficiency benchmarks.
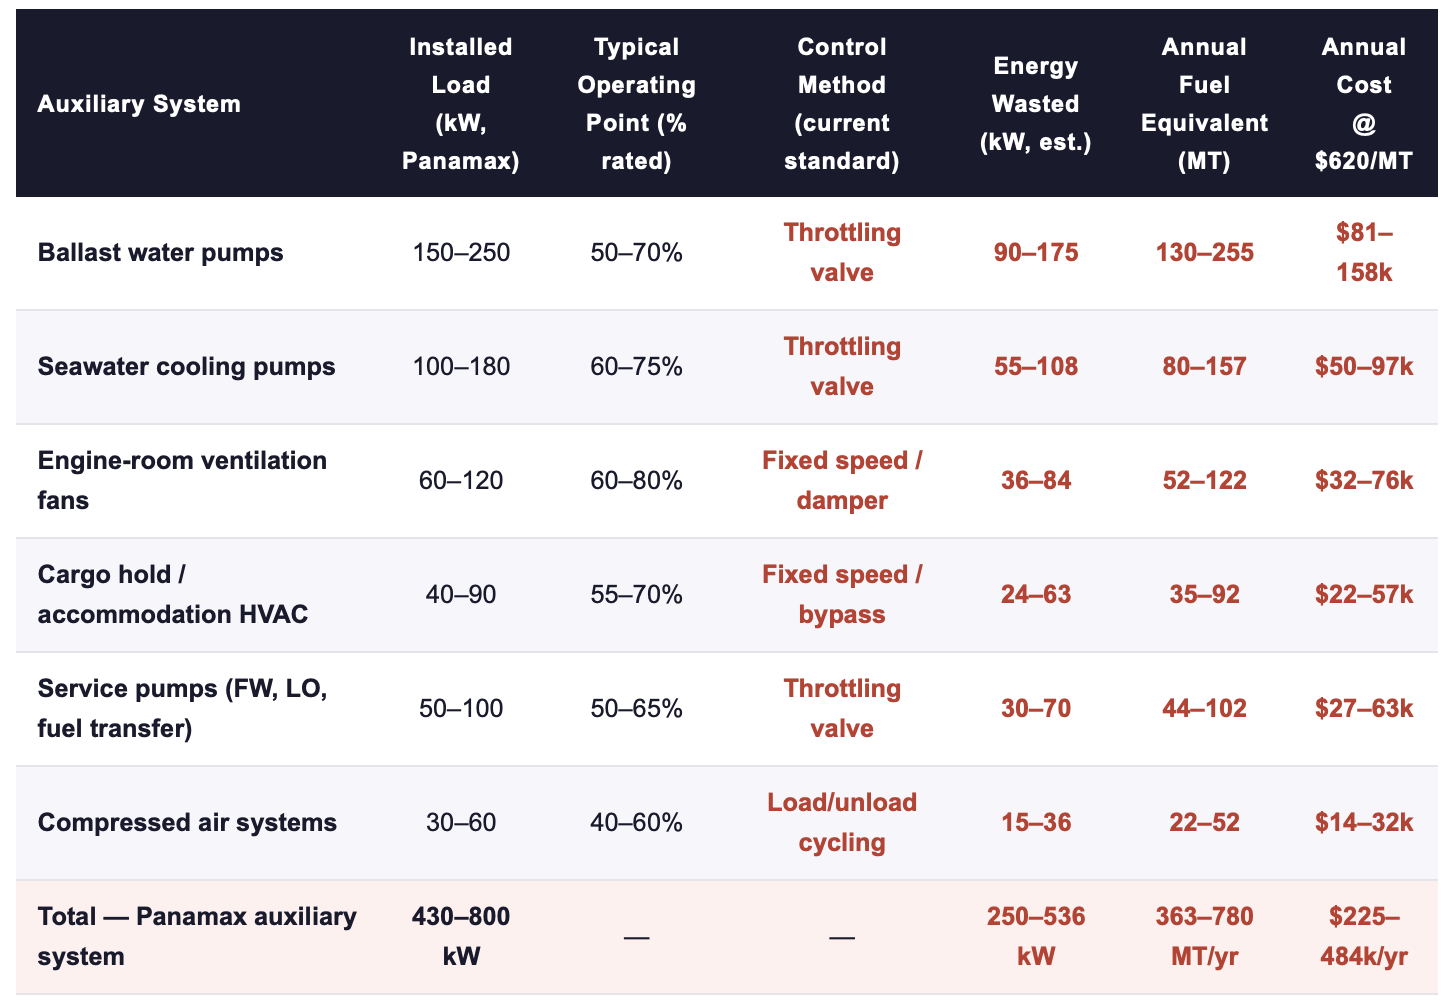
Estimates based on University of Piraeus auxiliary systems study, 2025; ABS Retrofits for Energy and Emissions Improvement, 2025; Wärtsilä Lifecycle Optimisation, 2026. Fuel equivalent at 180 g/kWh SFOC. Panamax 65,000 DWT reference vessel, 280 operating days.
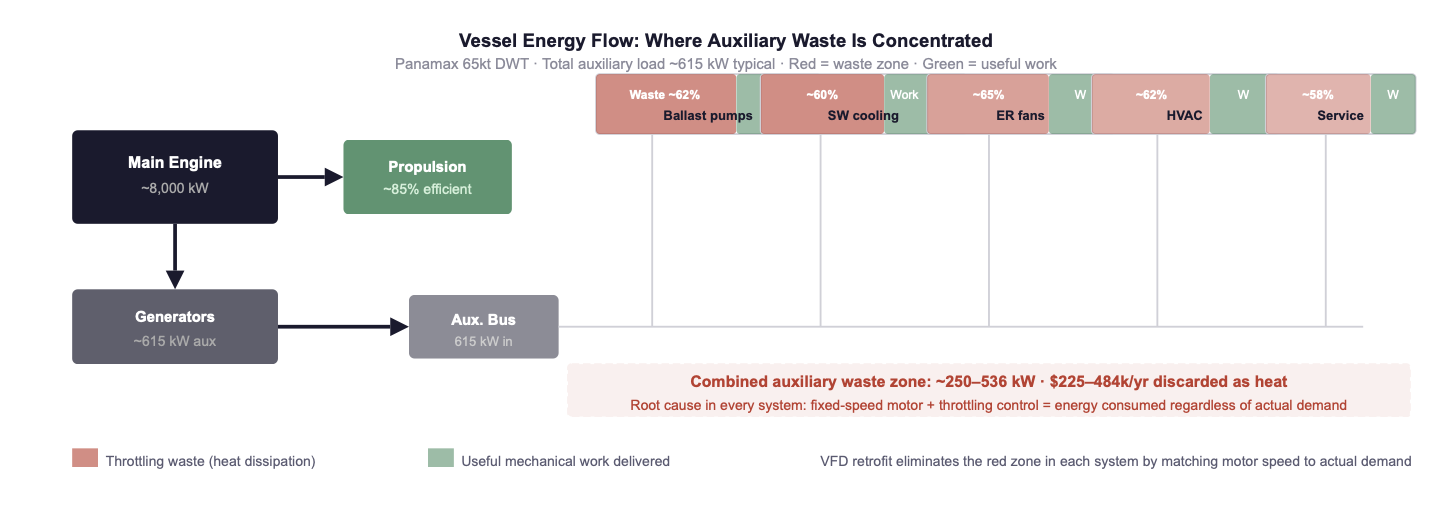
Fig. 1: Auxiliary energy flow for a Panamax vessel. Red portions represent throttling waste in each system; green represents useful work delivered. Total wasted power: 250–536 kW, continuously, on every operating day. VFD + IE4/IE5 upgrade eliminates this waste by design. Sources: University of Piraeus, 2025; ABS, 2025; Wärtsilä, 2026.
The critical observation from Fig. 1 is that the waste pattern is identical across all five auxiliary system categories: a fixed-speed motor running at full power, delivering excess energy to a throttling valve rather than to useful work. This is not five separate problems requiring five separate engineering solutions. It is one problem, the wrong control architecture, replicated across five system types. That fact has a direct organisational implication: the reason it has not been fixed is not that it requires five separate engineering projects. It is that it crosses the boundaries of three separate departments, each with different KPIs and different budget ownership.
👉 Key Insight: Marine energy waste is not a technology problem. The technology, VFDs, IE4/IE5 motors, system integration, has been available and proven for over a decade. It is a system-design and incentive problem: the wrong control architecture is perpetuated by departmental silos that each own a piece of the solution but none of which owns the whole. That is what makes system-level intervention the only complete fix.
2. The Root Causes: Three Silos, Three Failure Modes
The Global Maritime Forum's January 2026 report is unusually direct in its diagnosis. "Maritime operational efficiency hampered by leadership challenges" does not identify technology gaps, financing constraints, or regulatory uncertainty as the primary barriers to efficiency deployment. It identifies organisational structure, specifically departmental silos and misaligned incentives, as the dominant blocking factor. The diagnosis deserves the same clarity in the response.
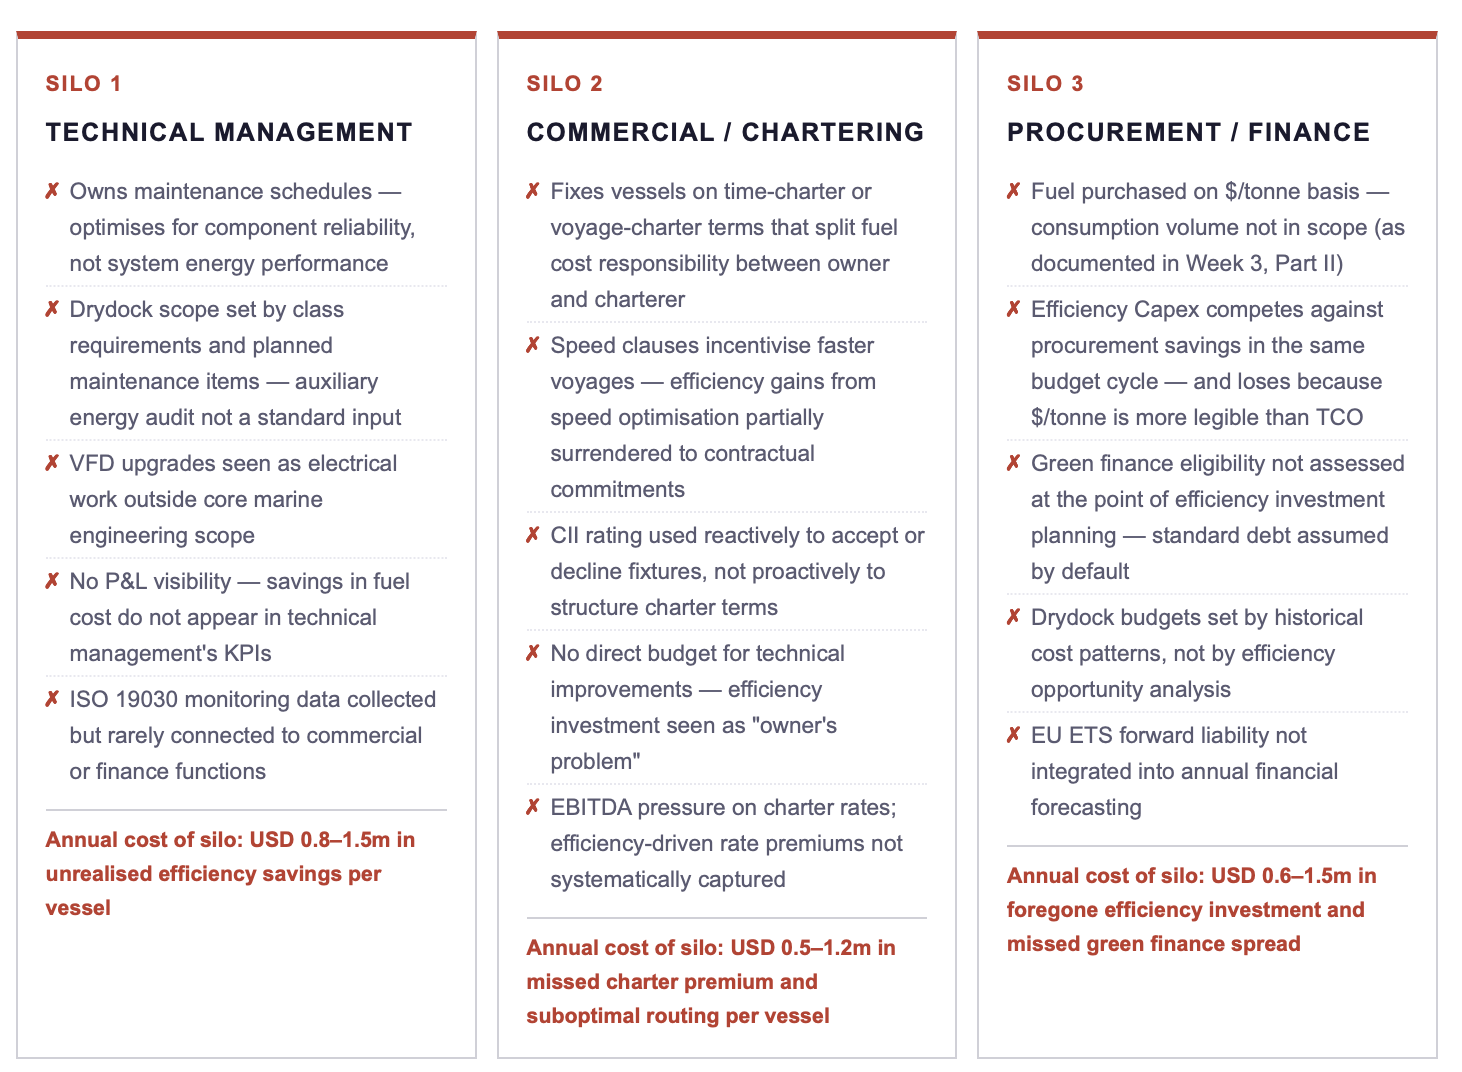
The cumulative cost of the three silos, USD 1.9–4.2 million per vessel per year, is not the sum of three separate management failures. It is the cost of a single systemic failure: the absence of a unified energy governance framework that connects technical performance, commercial positioning, and financial optimisation through a shared metric. The waste documented in Fig. 1 persists not because engineers do not know how to eliminate it, but because no single function has both the mandate and the budget authority to do so across all six auxiliary systems simultaneously.
👉 Key Insight: The three-silo structure converts what should be a straightforward system engineering decision, upgrade the control architecture across all high-load auxiliary circuits, into a political negotiation across three budget owners with incompatible KPIs. The GMF (2026) finding is that this governance architecture is the primary reason available technology remains undeployed. Fixing individual components without fixing the governance structure produces partial results indefinitely.
3. Evidence from Recent Industry Analysis
Two sources from early 2026 provide the evidential foundation for the systemic diagnosis. They are worth examining directly, because they represent practitioner-level acknowledgement of what technical and commercial literature has identified for years.
📻 LLOYD'S LIST PODCAST — MARCH 2026 (90POE)
The episode "Emissions compliance data can deliver efficiency and competitive advantage" makes a finding that is structurally consistent with the silo diagnosis: the data required to identify and quantify auxiliary system inefficiency already exists on most vessels — in ISO 19030 monitoring systems, SEEMP III logs, and EU ETS reporting databases. The reason this data does not translate into efficiency investment decisions is not data quality or data access. It is that the data lives in compliance systems and is reviewed by compliance functions — neither of which has a mandate to authorise maintenance expenditure or influence charter terms. The data is available; the governance pathway to act on it is not.
Source: Lloyd's List Shipping Podcast, "Emissions compliance data can deliver efficiency and competitive advantage," March 2026, 90POE.
📖 GLOBAL MARITIME FORUM — JANUARY 2026
The report "Maritime operational efficiency hampered by leadership challenges" provides the broadest cross-industry evidence for the systemic diagnosis. Surveying owners, operators, and charterers across vessel segments, the GMF finds that the most frequently cited barrier to efficiency improvement is not the cost of technology, not the availability of suitable products, and not the complexity of installation. It is leadership and organisational alignment: specifically, the absence of unified accountability for energy performance across technical, commercial, and finance functions. The GMF frames this as a "leadership challenge" — but the operational consequence is a procurement structure, a chartering structure, and a maintenance structure that each partially address the energy problem while collectively ensuring it remains unresolved.
Source: Global Maritime Forum, "Maritime operational efficiency hampered by leadership challenges," Operational Efficiency Report, January 2026.
The convergence of these two sources, one focused on data utilisation, one focused on organisational structure, points to the same underlying problem from different directions. Compliance data that exists but cannot be acted on, and technology that is proven but cannot be authorised, are both symptoms of the same governance gap. The solution, as both sources imply without stating it explicitly, is a unified energy governance structure with cross-functional ownership of the efficiency outcome.

Sources: Global Maritime Forum Operational Efficiency Report, January 2026; Lloyd's List Shipping Podcast, March 2026 (90POE); ABS, 2025; University of Piraeus, 2025.
👉 Key Insight: The technology row is green. Every other row is red. This is the clearest possible expression of the GMF's finding: operational efficiency in maritime is not a technology problem. The barriers are governance, incentive alignment, and budget authority, all of which are within management's control to change, without waiting for new technology, new regulation, or new financing instruments.
4. The System-Level Fix: What Integrated Efficiency Actually Delivers
The system-level fix does not require a different technology from what has been documented in this series. It requires deploying the same technology, hull coating, propeller optimisation, VFD and IE4/IE5 motor upgrades, as an integrated system rather than as isolated component decisions. The difference in outcome is significant and measurable.
When a drydock package is scoped by a unified energy function with cross-system authority, three things happen that do not happen when components are upgraded individually. First, the sequencing of upgrades can be optimised across systems, hull work and propulsion work create the baseline for accurate auxiliary system sizing, eliminating the risk of over- or under-specified VFD installations. Second, inter-system effects are captured: a cooler, more efficiently ventilated engine room reduces auxiliary cooling demand, which reduces the required flow rate on the seawater cooling circuit, which reduces the VFD setpoint, which reduces energy consumption, a cascade that component-level upgrades cannot model or capture. Third, the combined Capex qualifies for a single green finance facility rather than multiple standard-term financing arrangements, capturing the 40–60 basis point spread advantage on the total package.
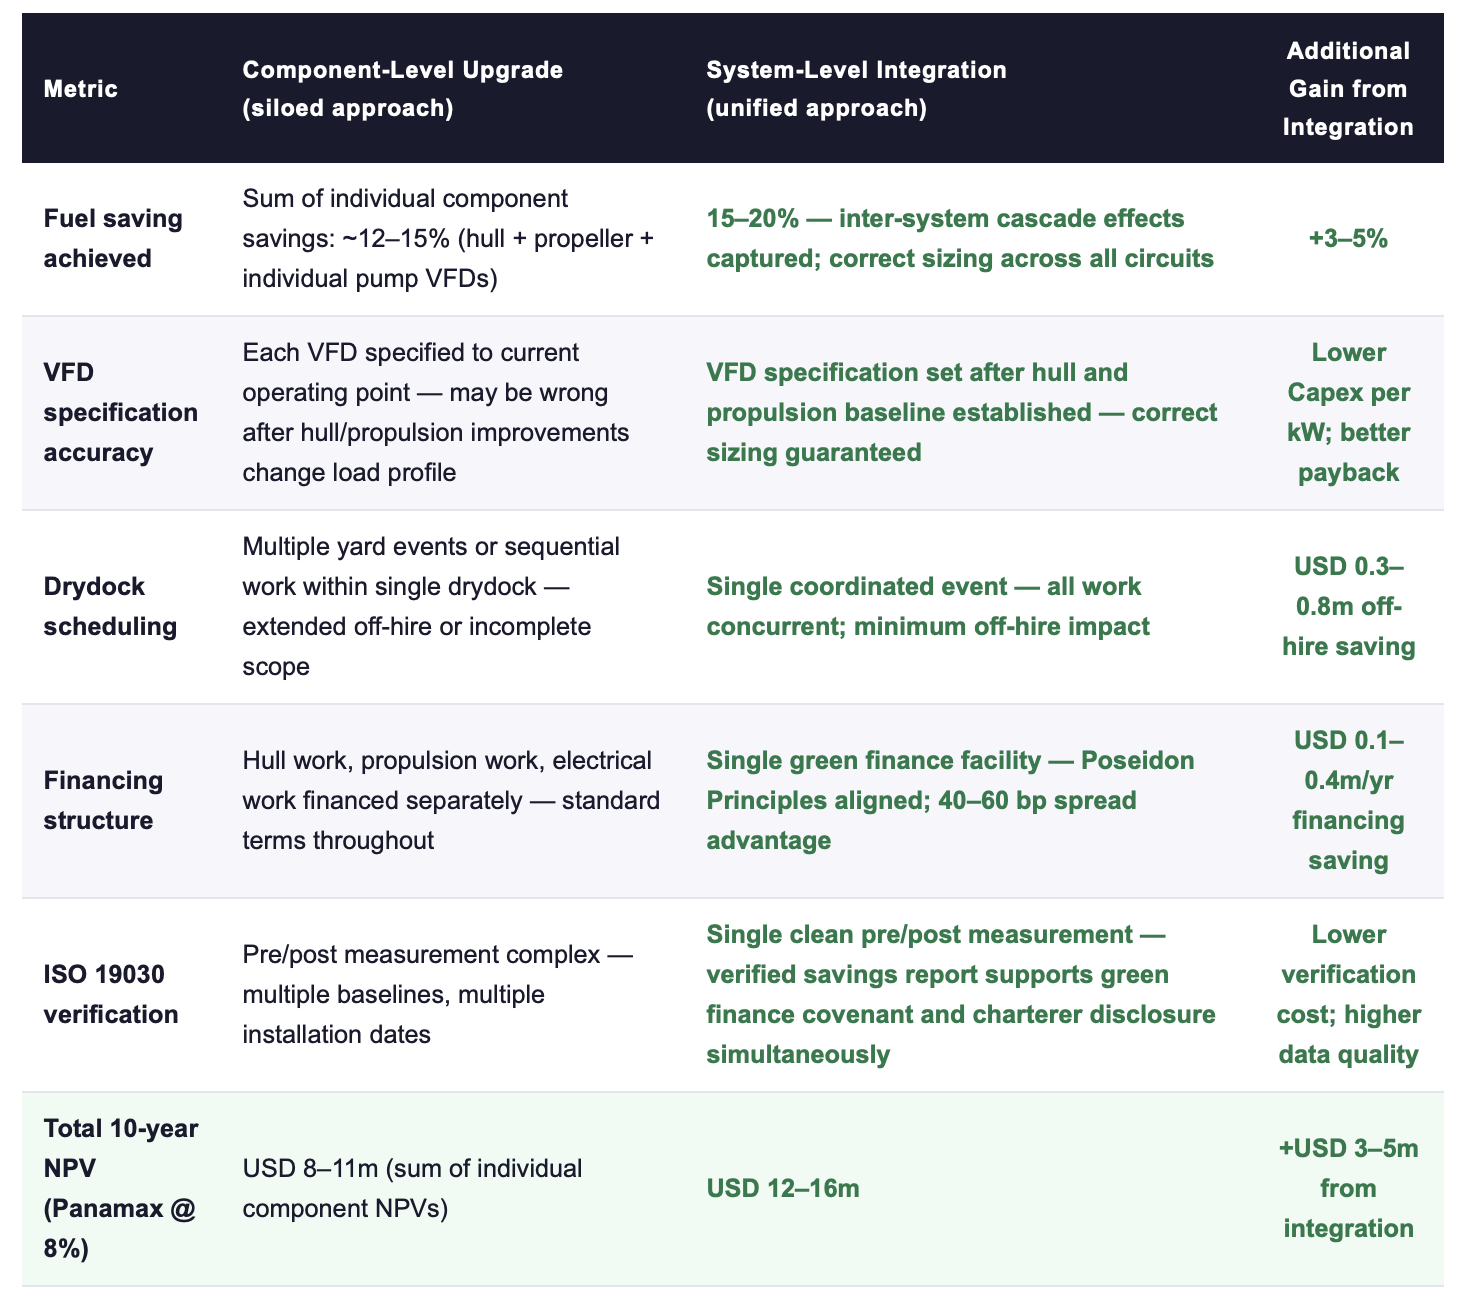
Sources: ABS Retrofit Reports, 2025; Wärtsilä Lifecycle Optimisation, 2026; PwC, 2026; own modelling. Panamax 65,000 DWT; VLSFO $620/MT; 8% discount rate; 10-year horizon.
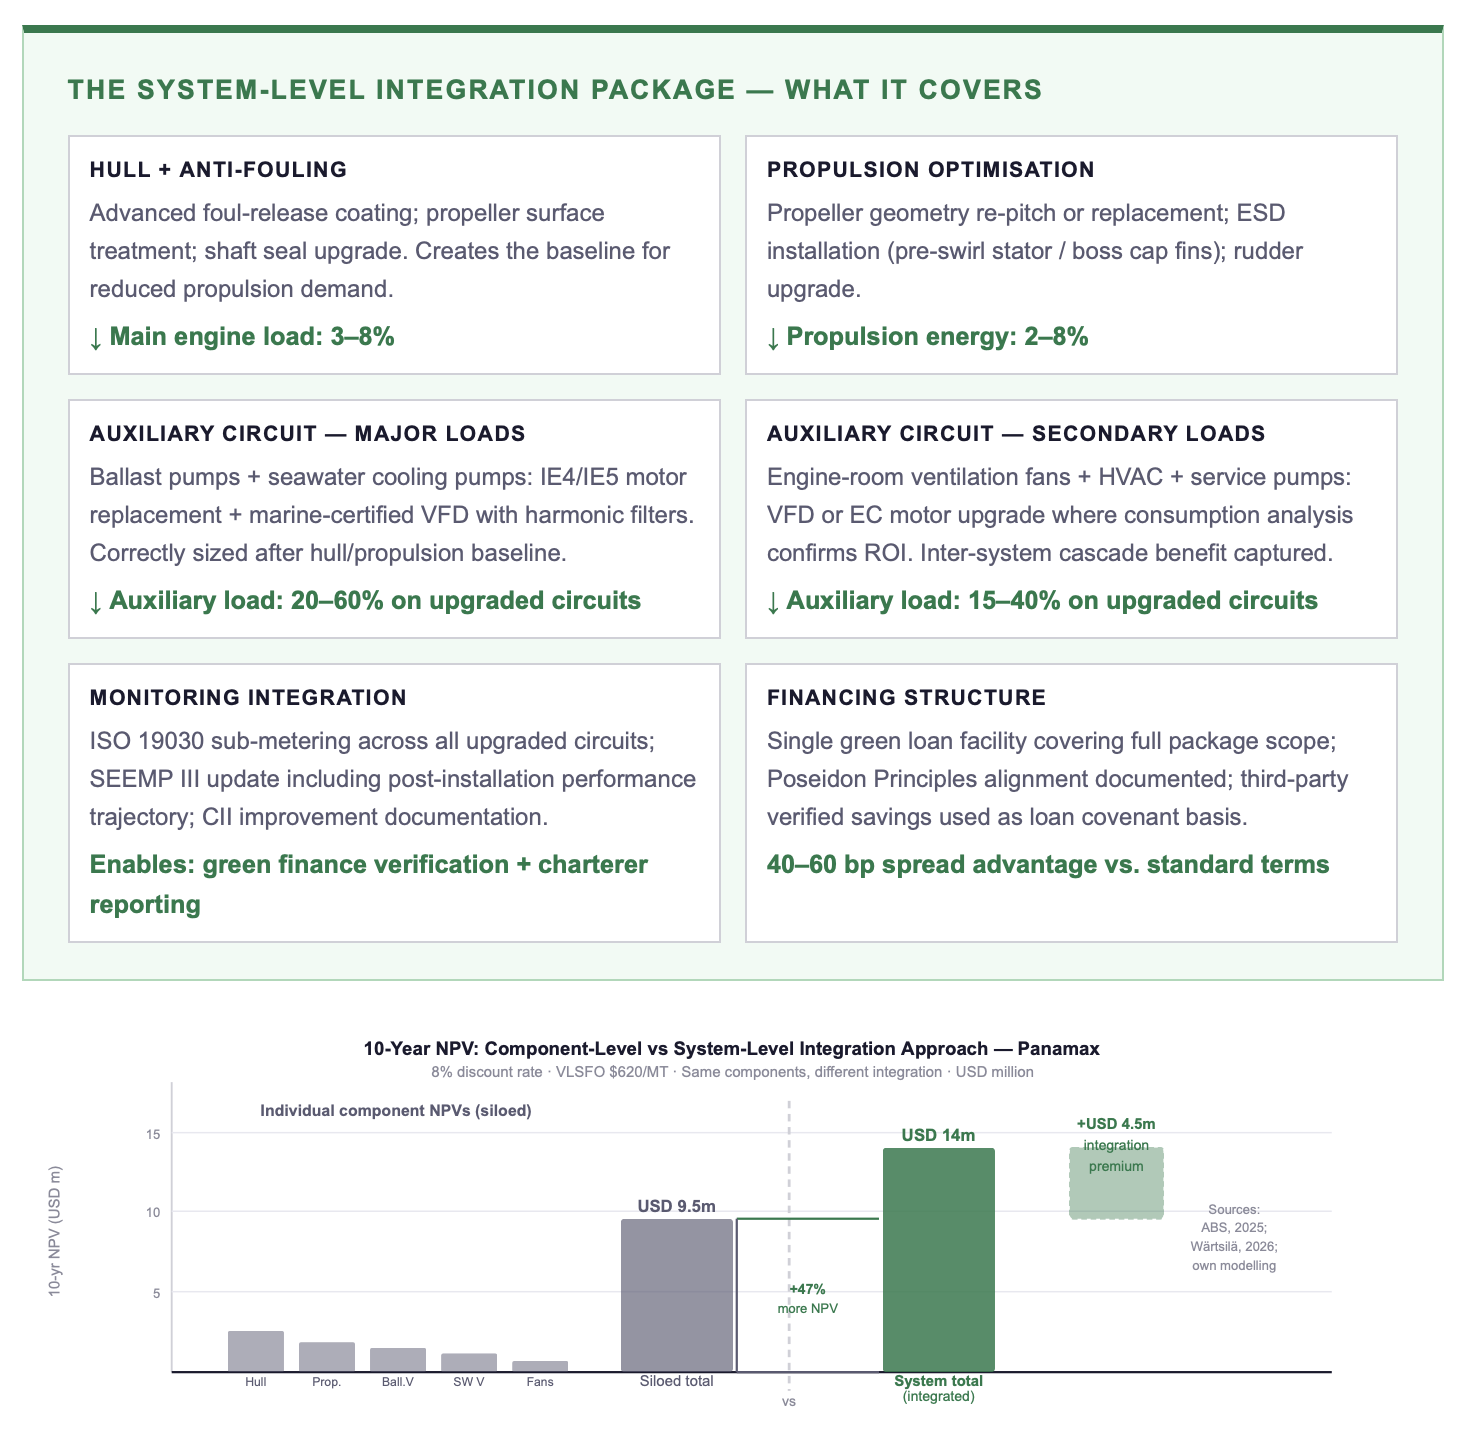
Fig. 2: 10-year NPV at 8% discount rate. Individual siloed component upgrades sum to USD 9.5m. System-level integration of the same components delivers USD 14m, a 47% NPV premium from integration effects: correct VFD sizing, inter-system cascade, single green finance facility, and unified ISO 19030 verification. Sources: ABS, 2025; Wärtsilä, 2026; own modelling.
👉 Key Insight: The 47% NPV premium in Fig. 2 does not come from better technology. It comes from deploying the same technology as a system rather than as isolated components, capturing sizing accuracy, inter-system cascade effects, financing efficiency, and verification simplicity that siloed upgrades forfeit by definition. This is what the GMF (2026) means by "leadership challenges": the barrier is not what technology to buy, but how to organise the decision to buy it.
5. Breaking the Silos: What Unified Energy Governance Looks Like in Practice
The transition from siloed to unified energy governance does not require organisational restructuring. It requires three specific changes to how decisions are connected across the existing structure, changes that the evidence from the GMF, the Lloyd's List podcast, and the series documented in this post all point toward.
The first change is a shared energy metric. Total energy cost per voyage, as documented in Week 15, Part II, must replace the three incompatible silo metrics ($/tonne for procurement, fixture rate for chartering, maintenance cost for technical management) with a single number that all three functions contribute to and are measured against. This metric makes the auxiliary waste visible to functions that currently have no financial incentive to see it.
The second change is a unified drydock planning process. The technical superintendent, the commercial director, and the CFO must review the drydock scope together, using the auxiliary waste map (as in Fig. 1) as the shared analytical input. This review should happen 12–18 months before each drydock, allowing sufficient time for VFD specification, green finance structuring, and charter term adjustment.
The third change is connected data. ISO 19030 monitoring data, EU ETS reports, and CII rating trajectory must flow into commercial and financial decision-making, not just into compliance reporting. The technology for this integration already exists in every vessel management system and voyage management platform currently in use. The barrier is not the technology. It is the governance decision to connect the data to the functions that can act on it.
ACTION RECOMMENDATIONS
IMMEDIATE MEASURES (0–90 DAYS)
Commission a cross-functional auxiliary system waste audit for your top three vessels: map every high-load circuit (pumps, fans, compressors) against current control mode and operating point, quantify the total annual waste in kWh, MT, and USD using the methodology in Fig. 1.
Run a governance test: ask three people, your DPA, your charter director, and your CFO, what the total energy cost per voyage was for your highest-consuming vessel last quarter. If they give three different numbers, the silo structure is confirmed and the governance gap is quantified.
Pull ISO 19030 and EU ETS data from your highest-consumption vessel and present it to the commercial team, establish whether compliance data currently feeds charter negotiation. If it does not, identify the governance step required to connect it.
For the next scheduled drydock: before the scope is finalised, require a parallel efficiency analysis covering all major auxiliary circuits. This is the minimum intervention to break the component-level upgrade cycle.
STRATEGIC COMMITMENTS (6–24 MONTHS)
Establish a unified pre-drydock review process: technical superintendent, commercial director, and CFO jointly review the drydock scope against the auxiliary waste map 12–18 months before each planned yard event, efficiency opportunity analysis is a mandatory agenda item.
Replace silo-specific energy KPIs with a single shared metric: total energy cost per voyage (fuel + EU ETS + charter impact) cascaded to technical, commercial, and procurement functions with shared accountability.
Structure the next drydock package as a unified scope: hull, propulsion, and full auxiliary circuit integration in one yard call, financed as a single green loan facility, do not allow scope fragmentation by budget boundary.
Connect ISO 19030 monitoring output to the commercial function: CII trajectory and auxiliary efficiency data must be visible in charter negotiation preparation documents as standard, not as an optional technical annex.
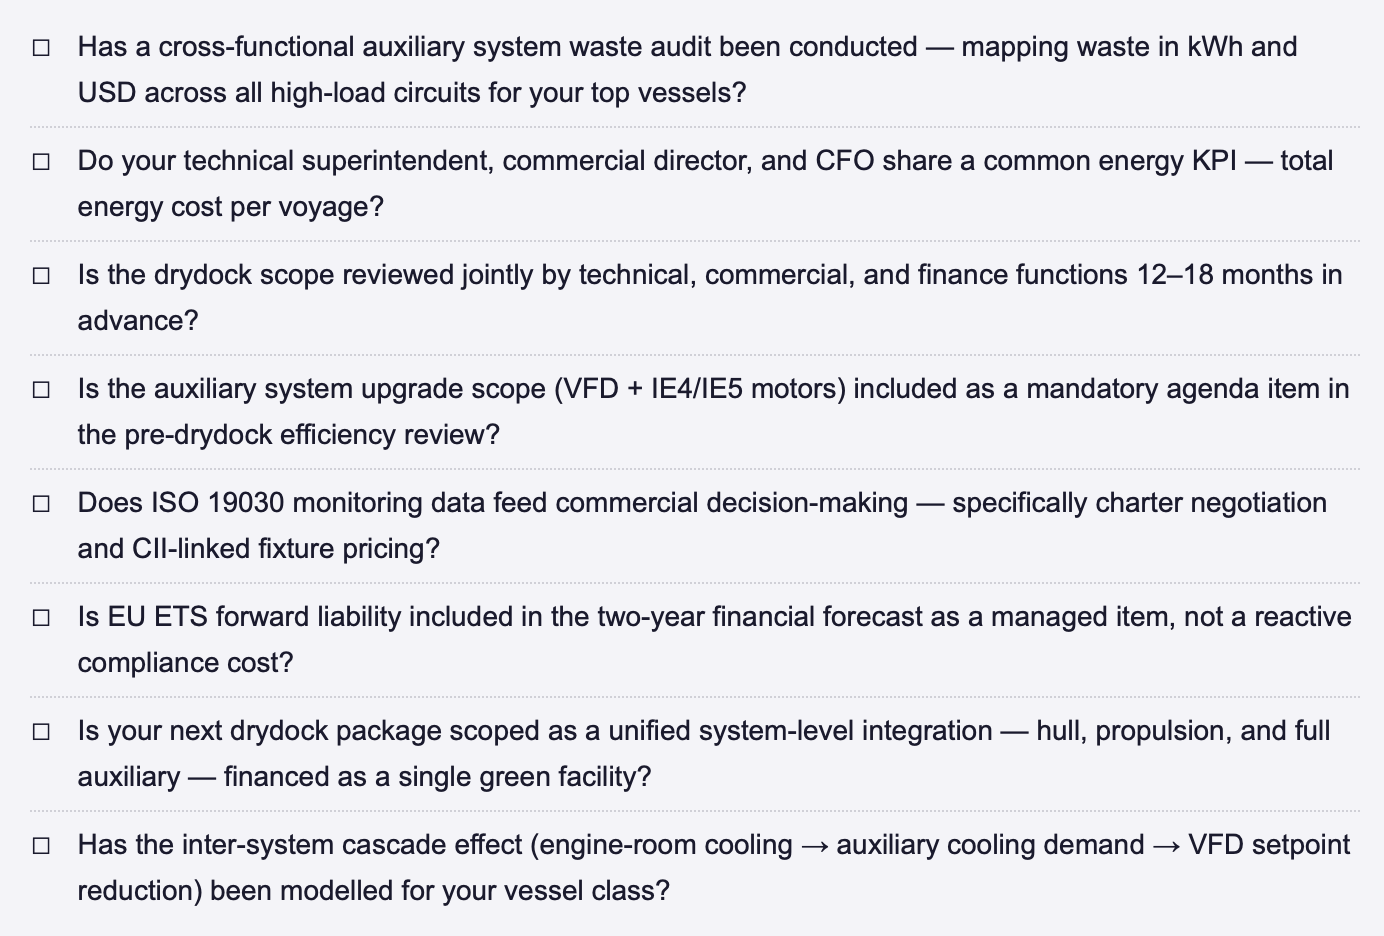
SYSTEM-LEVEL EFFICIENCY CHECKLIST, BREAKING THE SILO STRUCTURE
FINAL THOUGHT
The waste documented in Fig. 1: USD 225,000 to USD 484,000 per year on a single Panamax, discarded as heat through throttling valves, has existed on most vessels in service for the entire operating life of those vessels. It has not persisted because the solution is unknown. It has persisted because no function owns the problem across its full system extent. Technical management owns the pumps but not the charter structure. The commercial team owns the charter but not the maintenance scope. Procurement owns the fuel contract but not the efficiency investment. The result is a system-level problem managed at the component level by three functions that each see one third of the picture. The GMF (2026) calls this a leadership challenge. It is also a design choice, one that can be reversed with a governance decision, a shared metric, and a drydock scope review that puts all three functions in the same room with the same data. The technology will not wait. The financial returns will not wait. The question is whether the leadership decision can be made before the next drydock window closes.
Does your organisation have a cross-functional energy review process, and if so, what prompted it? Or is energy still managed separately by technical, commercial, and procurement functions with incompatible KPIs? Connect for a direct exchange or share your governance model. | This post completes Week 3 of the Efficiency Before Fuel series. The next instalment begins Week 4: Regulatory Roadmap 2026–2030, CII, EU ETS, and FuelEU Maritime as a sequenced compliance and efficiency investment framework.
Note: This article reflects my personal views based on industry experience and publicly available information. It does not constitute professional, legal, or investment advice and does not represent the views of my employer.
REFERENCES
ABS (American Bureau of Shipping) (2025) Retrofits for Energy and Emissions Improvement. Houston: ABS.
Global Maritime Forum (2026) Maritime operational efficiency hampered by leadership challenges: Operational Efficiency Report.Copenhagen: Global Maritime Forum. January 2026.
Lloyd's List Intelligence (2026) Shipping Intelligence Podcast: "Emissions compliance data can deliver efficiency and competitive advantage." Speaker: 90POE. March 2026. London: Lloyd's List.
University of Piraeus (2025) Energy Saving Potential of Variable Frequency Drives on Ballast and Seawater Cooling Pump Systems in Commercial Vessels. Piraeus: Department of Maritime Studies.
Wärtsilä Corporation (2026) Lifecycle Optimisation Report: Total Cost of Ownership Analysis for Propulsion and Auxiliary Systems.Helsinki: Wärtsilä.
© René Grywnow, DBA · Strategic Intelligence Brief · April 2026Efficiency Before Fuel Series · Week 17, Part III
Note: This article reflects my personal views based on industry experience and publicly available information. It does not constitute professional, legal, or investment advice and does not represent the views of my employer.