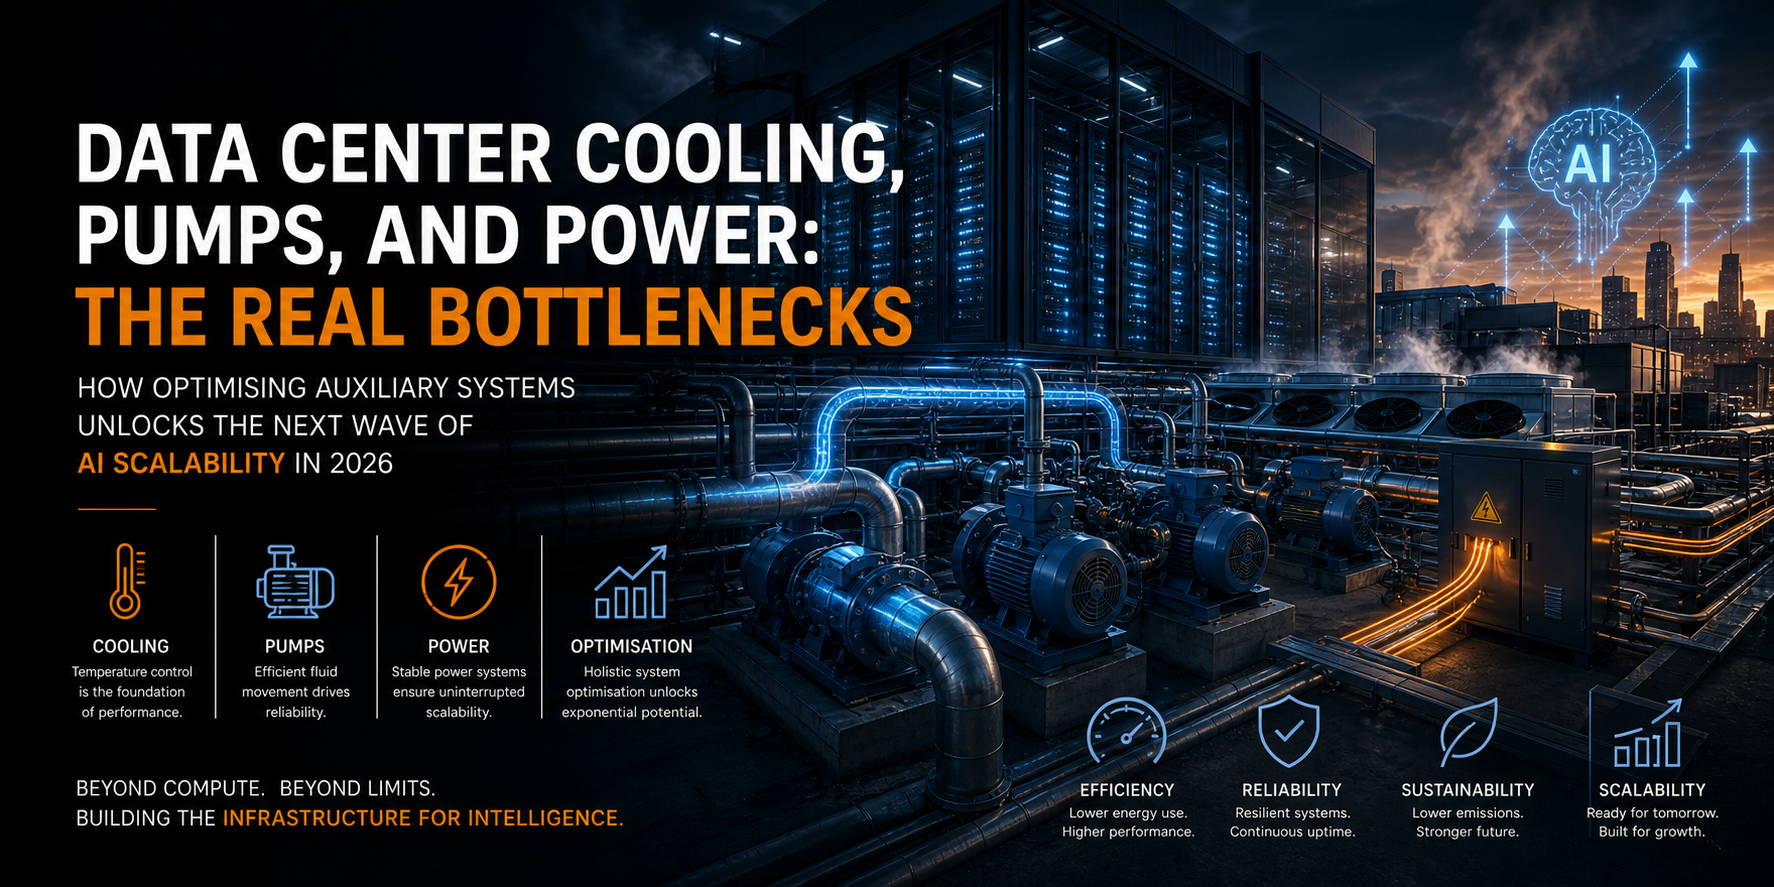
Data Center Cooling, Pumps, and Power: The Real Bottlenecks
ENERGY DOMINANCE · WEEK 19, PART II · APRIL 2026
How Optimising Auxiliary Systems Unlocks the Next Wave of AI Scalability in 2026
Data Center Infrastructure | Cooling + Power Bottlenecks | Strategic Intelligence Brief | René Grywnow, DBA
Part I of this week mapped the hidden infrastructure, the 33–59 MW of non-IT overhead consuming power without delivering compute. This post goes deeper into the three specific chokepoints that are now the binding constraint on GW-scale AI deployment: cooling loops that cannot reject heat fast enough, pumps that waste 40–70% of their energy through fixed-speed operation, and power distribution architectures that were designed for a load they no longer serve. These are not theoretical inefficiencies. They are measurable, system-level failures that determine how fast, and whether, the next wave of AI capacity comes online.
EXECUTIVE SUMMARY
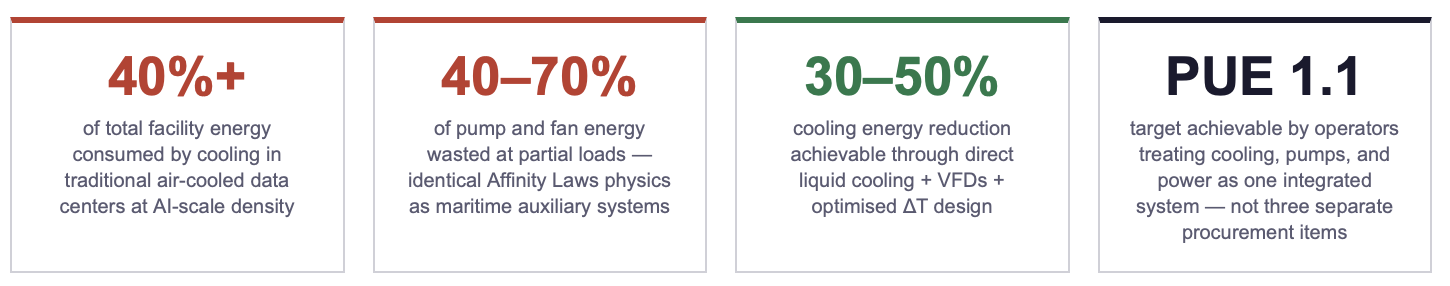
Cooling represents the dominant energy bottleneck in AI-scale data centers: up to 40%+ of total facility energy in air-cooled environments, with pumps and fans comprising a major and systematically under-optimised share. At rack densities above 30 kW, air cooling is physically exhausted. The transition to liquid cooling is no longer a design option, it is a deployment prerequisite.
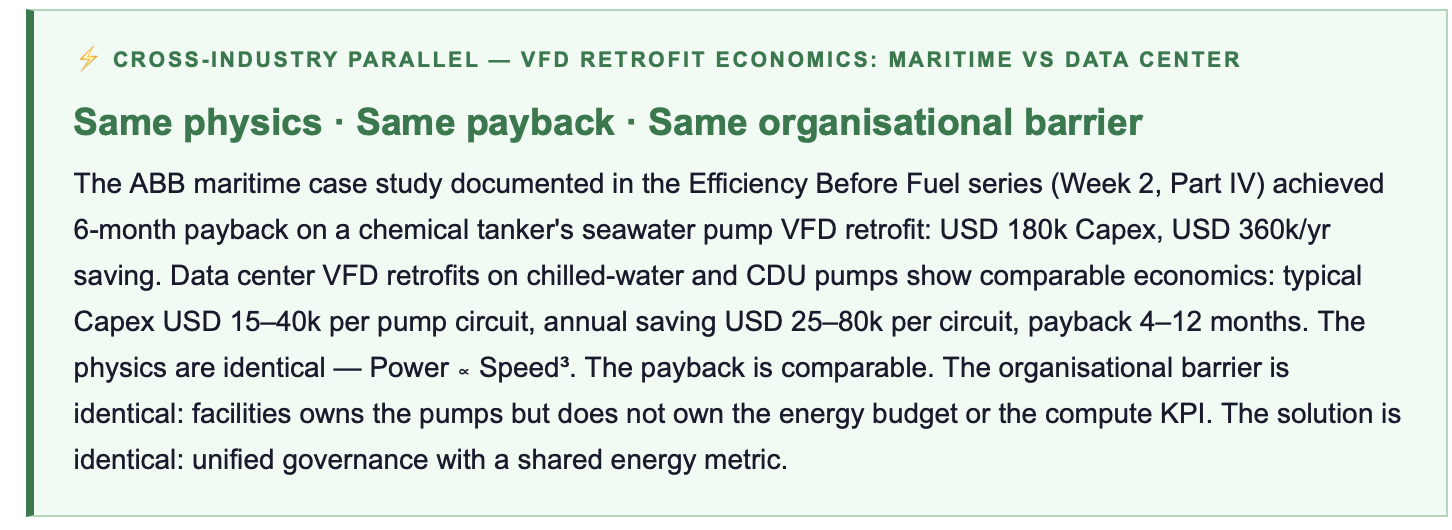
Pump and fan systems in data center cooling loops exhibit the same Affinity Laws physics documented in the maritime Efficiency Before Fuel series: fixed-speed operation with throttling control wastes 40–70% of energy at typical partial-load operating points. VFD retrofits deliver identical savings, 40–70% on upgraded circuits, with the same payback economics (6–24 months) and the same compounding cascade effect (reduced pump waste → reduced cooling load → reduced secondary rejection energy).
Facilities that master these auxiliary systems achieve measurably superior outcomes: higher supportable rack density, lower PUE (1.10–1.20 vs. 1.40–1.60), faster time-to-deploy (no cooling bottleneck on capacity expansion), and a structural TCO advantage of 15–30% versus peers operating legacy infrastructure. The bottleneck is no longer theoretical. It is the chokepoint that determines who scales and who waits.
1. The Scale of Auxiliary Waste: Measurable, Not Theoretical
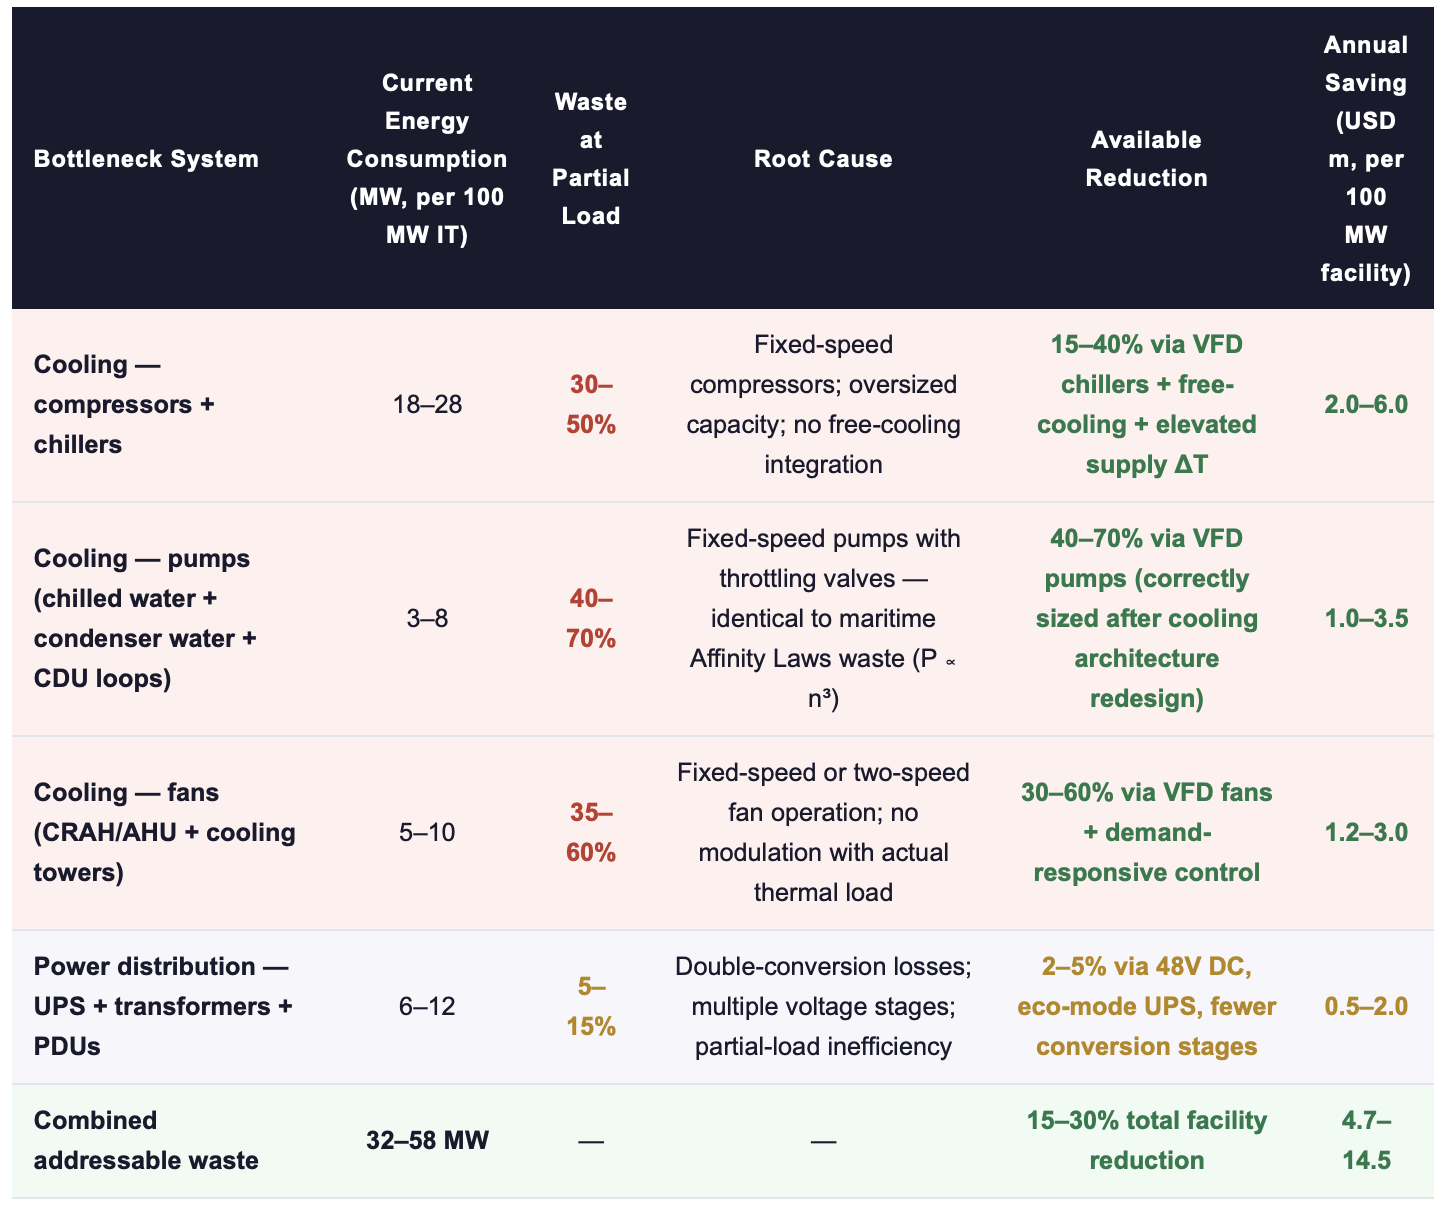
The previous post mapped the aggregate non-IT overhead at 33–59 MW in a 100 MW facility. This section disaggregates the three specific systems where waste is concentrated, quantifiable, and immediately addressable, and where the parallel to maritime auxiliary system waste is structurally exact.
Sources: IEA (2026); Data Centre Solutions on pumps (2026); TSMC/HP liquid cooling reports (2025); ScienceDirect (2025); industry benchmarks. Annual saving at average US commercial rate ~$85/MWh, 8,760 hrs/yr.
The pump waste row deserves particular attention because it demonstrates the cross-industry structural parallel with greatest precision. A chilled-water pump in a data center cooling loop operates under exactly the same physics as a ballast pump on a Panamax vessel: centrifugal load, variable demand, fixed-speed motor, throttling valve converting excess flow into heat and pressure drop. The Affinity Laws apply without modification.
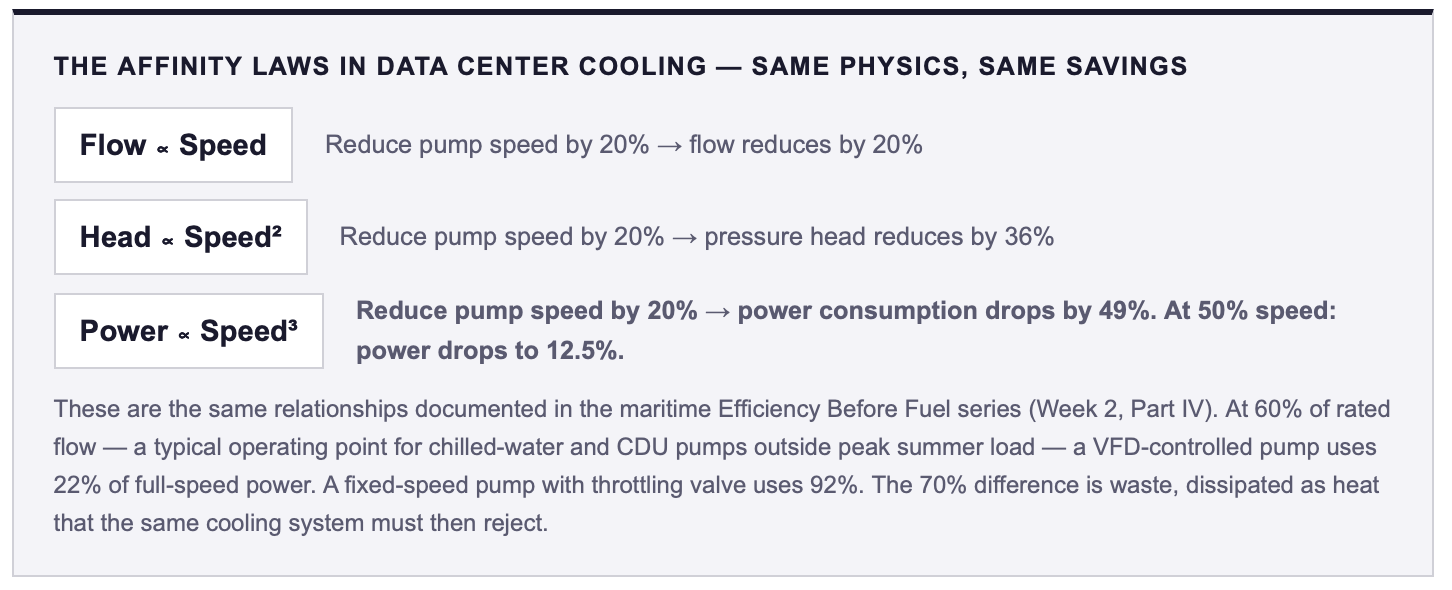
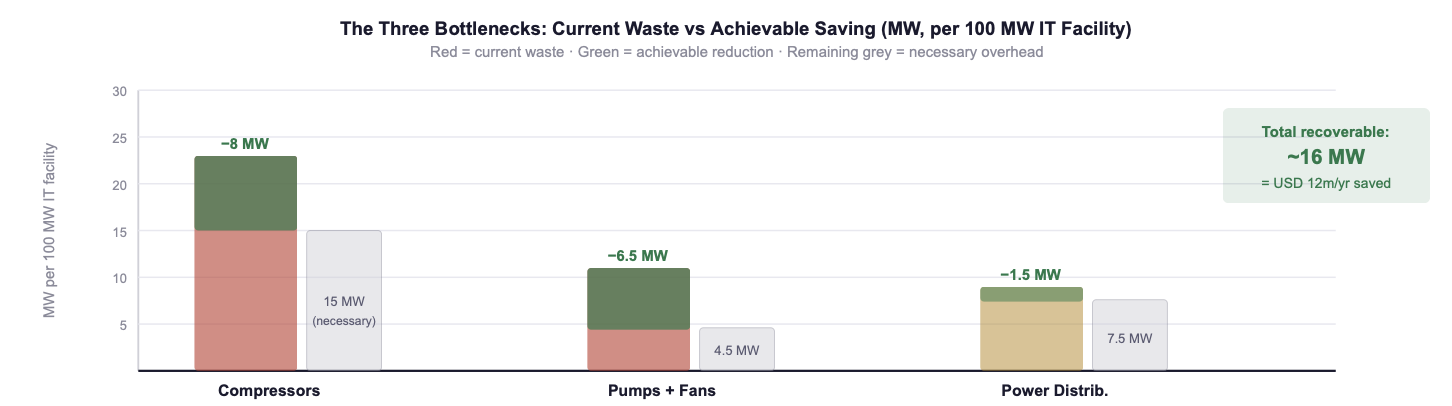
Fig. 1: The three bottlenecks disaggregated: current waste (red) and achievable saving (green) for compressor/chiller, pump/fan, and power distribution systems in a 100 MW AI data center. Combined recoverable waste: approximately 16 MW, equivalent to USD 12m per year in energy cost at $85/MWh. Sources: IEA (2026); Data Centre Solutions (2026); industry benchmarks.
👉 Key Insight: The bottlenecks are no longer theoretical; they are measurable, system-level failures that are today blocking GW-scale AI rollout. A facility that cannot reject 80+ kW of heat per rack cannot deploy frontier GPUs, regardless of how many it has purchased. A cooling loop running fixed-speed pumps at 60% load is consuming 4× more pump energy than necessary, and that excess energy generates secondary heat that consumes additional cooling energy. The bottleneck is not a constraint to be accepted, it is a waste stream to be eliminated.
2. The Three Bottlenecks in Detail: What Is Failing and Why
BOTTLENECK 1: COOLING ARCHITECTURE: AIR CANNOT SCALE TO AI DENSITY
Air cooling at 30+ kW per rack is not merely inefficient, it is physically constrained. The specific heat capacity of air (1.005 kJ/kg·K) and its density (~1.2 kg/m³) mean that removing 80 kW from a single rack requires airflow volumes that exceed the practical envelope of any raised-floor or contained-aisle design. Liquid cooling, whether direct-to-chip cold plate or single-phase immersion, operates with working fluids that have 1,000–3,500× the volumetric heat capacity of air. The physics are not contested. What is contested, inside most organisations, is who owns the decision to transition.
The commercial consequence of this physical constraint is measurable: facilities that attempted to support 60+ kW racks with air cooling in 2024–2025 experienced thermal throttling (GPUs reducing clock speed to manage temperature), resulting in 10–25% compute performance loss on hardware that was already purchased, installed, and drawing power. The GPU operates at full electrical load; the compute output is derated. This is the most expensive form of cooling failure, it consumes maximum power while delivering reduced output.
BOTTLENECK 2: PUMP AND FAN SYSTEMS: THE MARITIME PARALLEL AT SCALE
Data centre cooling loops, chilled-water primary and secondary, condenser-water, and CDU (Coolant Distribution Unit) circuits for liquid-cooled racks, use centrifugal pumps that operate under the same Affinity Laws as maritime ballast and seawater cooling pumps. The overwhelming majority of installed pumps in data center cooling systems operate at fixed speed with throttling or bypass valves, consuming full motor power regardless of actual thermal demand. At 60% of rated flow, a typical operating point during 70–80% of operating hours outside peak summer, a fixed-speed pump consumes 92% of rated power; a VFD-controlled pump consumes 22%. The difference, 70%, is wasted as heat that the cooling system must then reject.
The compounding effect unique to data centers makes pump inefficiency more expensive than in maritime applications: every kW of pump waste generates secondary heat, requiring approximately 0.3–0.5 additional kW of chiller and rejection capacity to remove. A 100 kW pump waste therefore costs 130–150 kW of total facility load. Maritime pump waste dissipates to the seawater, data center pump waste must be cooled by the very system creating it.
BOTTLENECK 3: POWER DISTRIBUTION: CONVERSION LOSSES COMPOUND SILENTLY
Power distribution in a conventional data center passes through four to six voltage conversion stages: utility medium-voltage → step-down transformer → UPS (AC→DC→AC) → PDU step-down → rack-level conversion. Each stage introduces losses of 1–4%, and the losses compound multiplicatively. The total power distribution efficiency of a conventional chain is 88–94%, meaning 6–12% of all power entering the facility is lost to heat in the electrical infrastructure before it reaches a single GPU.
The alternative, 48V DC bus architecture with single-stage conversion, reduces distribution losses to 2–4% by eliminating intermediate conversion stages. Google, Microsoft, and several hyperscale operators have deployed 48V bus architectures in new facilities, demonstrating measurable efficiency gains. The barrier to adoption in existing facilities is not technical, it is architectural: 48V DC requires a different rack power distribution design that cannot be retrofitted onto existing AC infrastructure without a full facility rebuild. This is why it matters most at the design stage of new facilities and is less relevant as a retrofit measure.
👉 Key Insight: The three bottlenecks are interdependent. Cooling that cannot reject heat fast enough causes thermal throttling on GPUs (Bottleneck 1). Pumps running at fixed speed waste 40–70% of their energy and generate secondary heat that increases the cooling load (Bottleneck 2). Power distribution losses reduce the usable power arriving at GPUs while generating additional heat (Bottleneck 3). Addressing any one in isolation produces real but limited gains. Addressing all three as a system, with correct sequencing: power architecture first, then cooling architecture, then pump/fan optimisation sized to the new thermal baseline, delivers the 3–4× TCO multiplier documented in Part I.
3. Quantified Opportunities: What 2025–2026 Deployments Demonstrate
The evidence from early adopters in the 2025–2026 deployment cohort confirms the theoretical potential documented above. Facilities that have deployed integrated liquid cooling + VFD pump/fan control + optimised power distribution are achieving measurably different outcomes from peers operating on legacy infrastructure with the same GPU hardware.
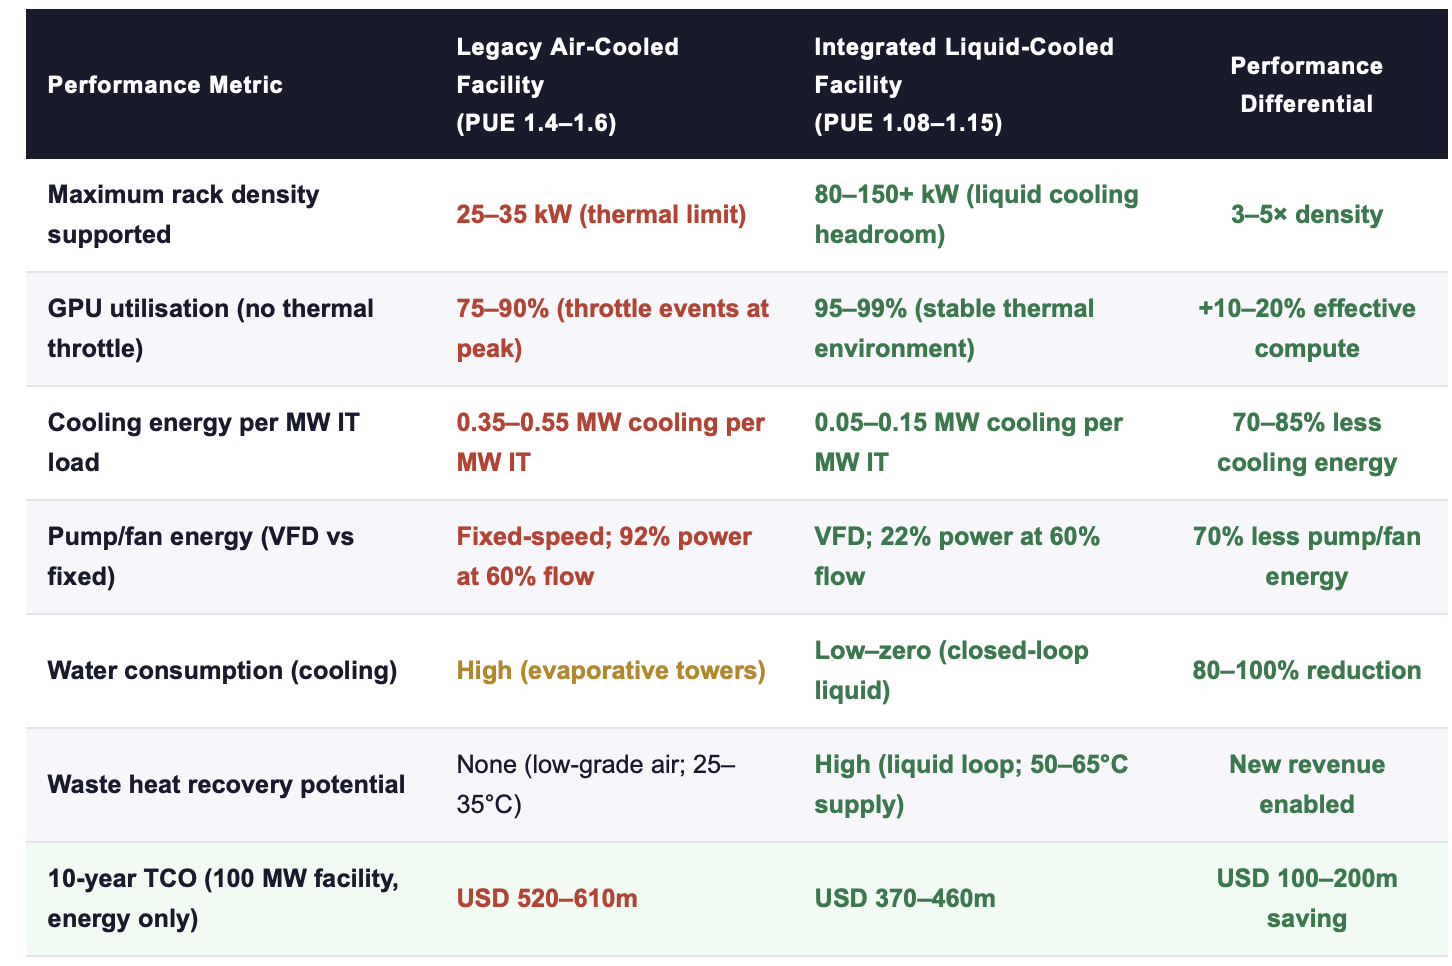
Sources: IEA (2026); TSMC/HP liquid cooling deployment reports (2025); Data Centre Solutions (2026); industry benchmarks. 10-yr TCO at average US commercial electricity $85/MWh, 8,760 hrs/yr, including maintenance differential.
👉 Key Insight: The 10-year energy TCO differential between a legacy air-cooled and an integrated liquid-cooled 100 MW AI facility is USD 100–200 million. This is not a marginal efficiency gain, it is a structural cost advantage that compounds every year the facility operates and that cannot be replicated by a competitor who chose air cooling at the design stage without a full facility rebuild.
4. The Practical Executive Playbook: From Bottleneck to Competitive Advantage
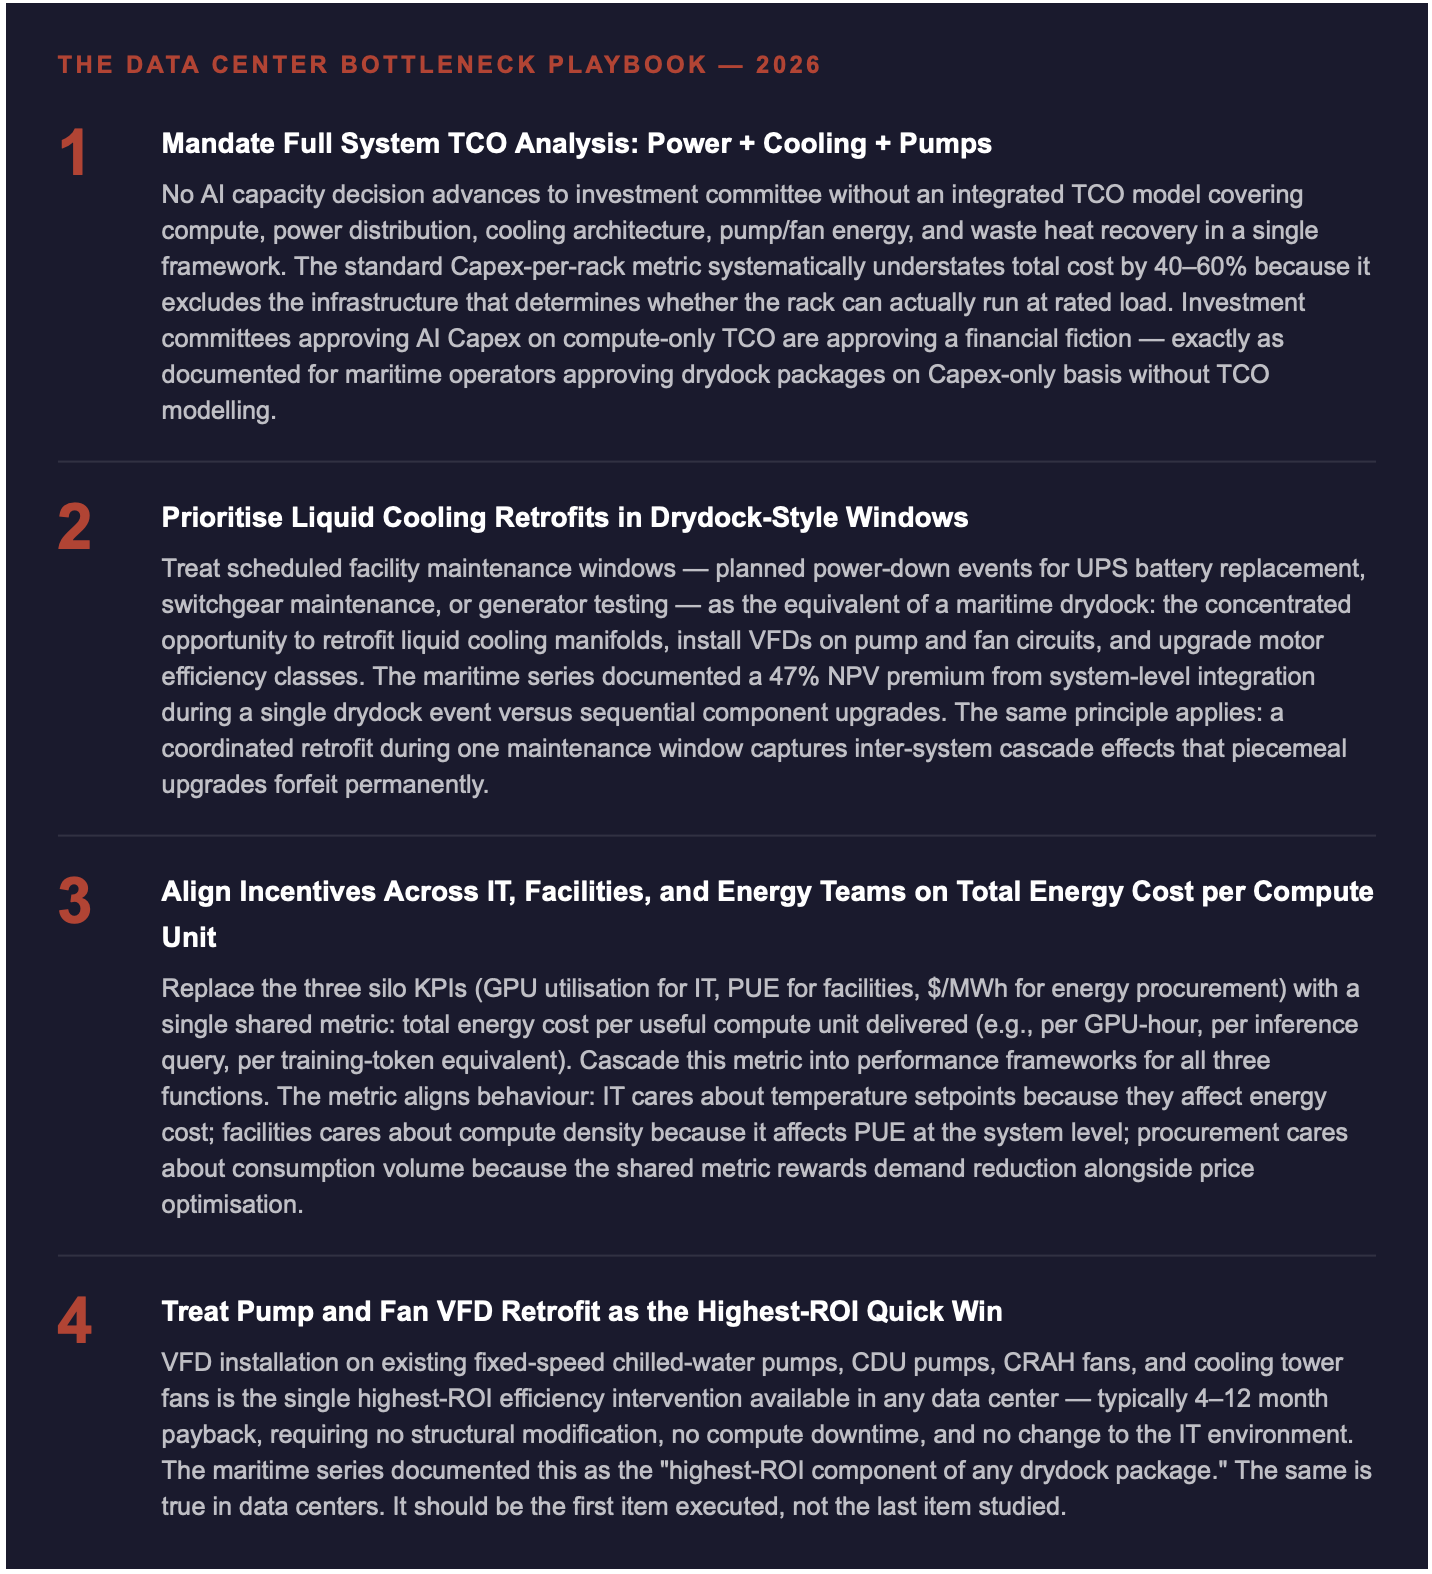
ACTION RECOMMENDATIONS
IMMEDIATE MEASURES (0–90 DAYS)
Audit every pump and fan circuit in your cooling infrastructure: identify which are operating at fixed speed with throttling or bypass control. The Affinity Laws guarantee 40–70% energy savings on these circuits with VFD retrofit, the physics is non-negotiable.
Measure GPU thermal throttling events: how many hours per month are your GPUs reducing clock speed due to cooling constraints? Multiply throttled hours by GPU power consumption, this is the cost of the cooling bottleneck expressed in wasted electricity on hardware delivering reduced output.
Calculate the secondary heat cost of pump and fan waste: every kW of pump waste generates 0.3–0.5 kW of additional cooling load. Add this to the direct pump energy cost to quantify the true system-level waste. Present this number alongside IT energy cost in the next executive review.
Identify the next scheduled maintenance window suitable for a coordinated cooling system retrofit: VFD installation on major pump and fan circuits, plus liquid cooling manifold installation if applicable. Scope it as a single integrated intervention, not a sequence of separate work orders.
STRATEGIC COMMITMENTS (6–24 MONTHS)
Mandate liquid cooling (direct-to-chip or immersion) as the design standard for all new AI deployments, no new facility proposal advances to investment committee with air cooling specified for racks above 30 kW.
Implement the unified energy metric: total energy cost per GPU-hour (or per inference query) shared across IT, facilities, and energy procurement. Review monthly at executive level. This is the single governance change that breaks all three silos simultaneously.
Build a VFD retrofit programme across the installed base: prioritise circuits by energy consumption ranking, schedule installations during maintenance windows, and track verified savings per circuit post-installation. This is the "fleet-wide motor register" concept from the maritime series applied to data center cooling infrastructure.
Evaluate waste heat recovery for every liquid-cooled facility: model the revenue potential from district heating or adjacent process-heat supply. In European markets with established district heating networks, waste heat offtake can offset 5–15% of annual facility energy cost, converting a cooling expense into a revenue stream.
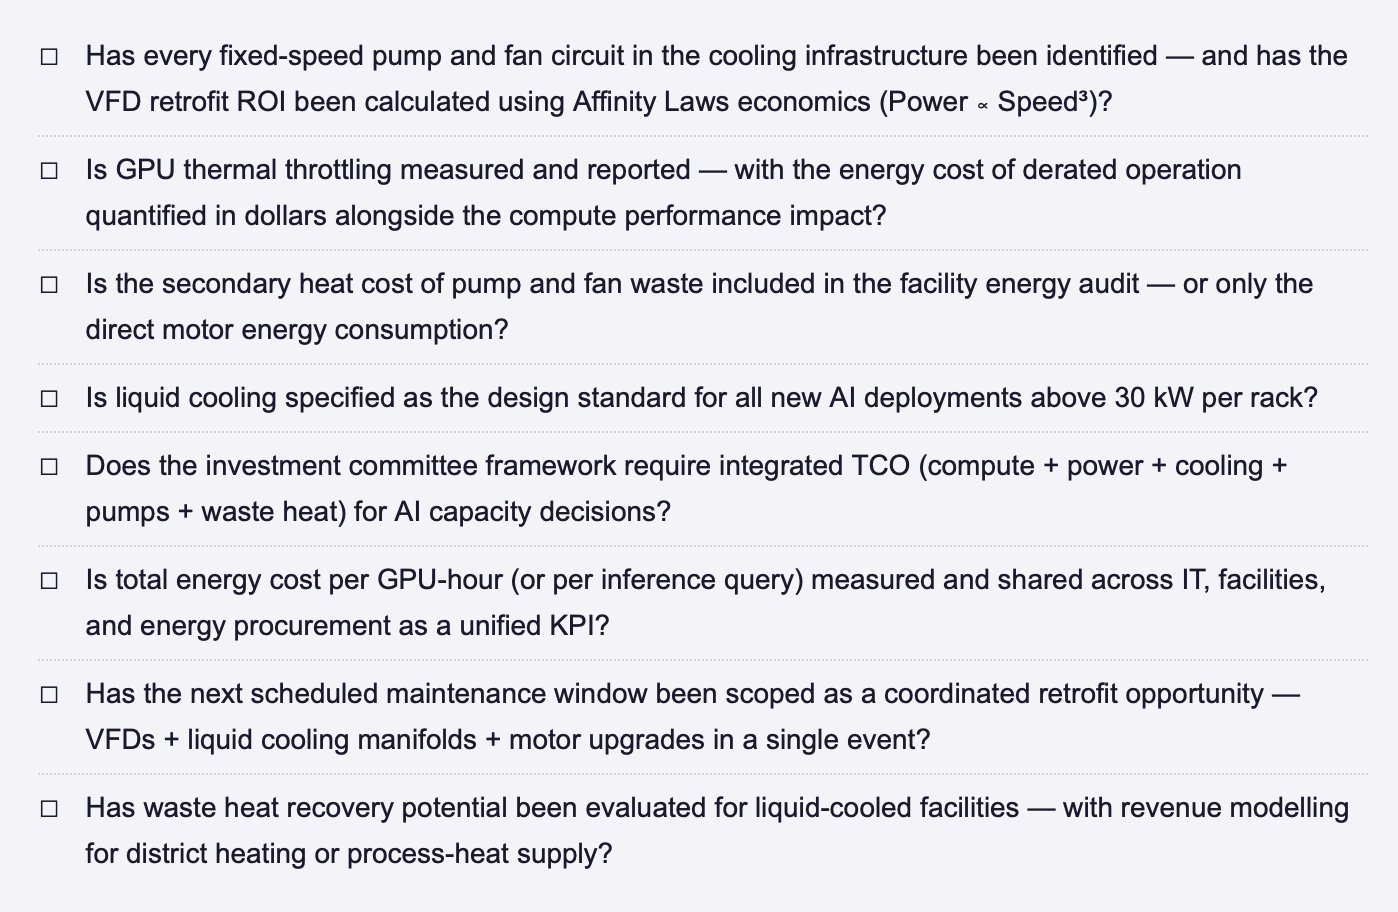
BOTTLENECK RESOLUTION CHECKLIST, DATA CENTER COOLING + POWER INFRASTRUCTURE
FINAL THOUGHT
The data center industry has spent the past five years in a race to buy more GPUs. The next five years will be defined by a different capability: the ability to extract maximum compute output from every watt that enters the facility. The operators who master the three bottlenecks, cooling architecture, pump and fan efficiency, and power distribution, will deploy more AI capacity from smaller grid connections, at lower cost, with faster time-to-market than competitors who continue throwing capital at hardware without addressing the infrastructure that determines whether it can actually run. The physics are known. The technology is proven. The economics are documented, in this series and in the maritime series that preceded it. What remains is the leadership decision to treat cooling, pumps, and power as a single integrated system rather than three separate procurement items. That decision is the bottleneck behind the bottleneck. And it is the one that only the executive team can resolve.
Have you measured the secondary heat cost of your pump and fan waste, and does your organisation treat VFD retrofit as a strategic investment or a maintenance item? Connect for a direct exchange or share your facility's bottleneck data. | This post completes Week 19 of the Energy Dominance series. Part I mapped the hidden infrastructure; Part II delivers the specific bottleneck diagnosis and the drydock-style retrofit playbook.
Note: This article reflects my personal views based on industry experience and publicly available information. It does not constitute professional, legal, or investment advice and does not represent the views of my employer.
REFERENCES
Data Centre Solutions (2026) Pumps in Data Centers: Efficiency, Variable-Speed Control, and Cooling Loop Optimisation. 2026.
IEA (International Energy Agency) (2026) Data centre electricity use surged in 2025. Paris: IEA. April 2026.
ScienceDirect (2025) AI-Driven Cooling Optimisation for Data Centers: A Systematic Review. Elsevier. 2025.
TSMC / HP (2025) Liquid Cooling Deployment Reports: Direct-to-Chip and Immersion Architectures for AI Training Infrastructure. 2025.
BCG / McKinsey (2025) Data Center Infrastructure Economics: Operational Efficiency and System Integration Pathways. Various publications. 2025.
© René Grywnow, DBA · Strategic Intelligence Brief · April 2026Energy Dominance · Week 19, Part II
Note: This article reflects my personalviews based on industry experience and publicly available information. It does not constitute professional, legal, or investment advice and does not represent the views of my employer.