Data Centers Are Not a Tech Problem. They Are an Energy Problem.
ENERGY DOMINANCE · WEEK 18, PART I · APRIL 2026
Why Power Demand — Not Compute Innovation — Is Now the Primary Constraint on AI Scaling
Tech Infrastructure | Energy Dominance | Strategic Intelligence Brief | René Grywnow, DBA
For a decade, the competitive question in digital infrastructure was: who has the best chips, the best software, the best architecture? That question has been answered,and it no longer decides who wins. In 2026, the competitive question is simpler and harder: who has the power? The companies scaling fastest in AI are not those with the most advanced models. They are those with secured gigawatts, grid interconnections approved, and cooling systems designed for 120 kW racks. Compute is abundant. Energy is not. That inversion is the defining shift of the current cycle.
EXECUTIVE SUMMARY
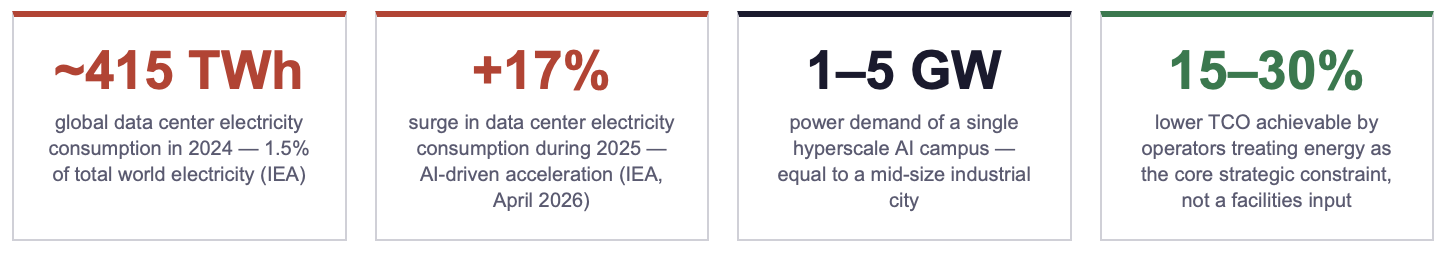
Global data center electricity consumption reached approximately 415 TWh in 2024, 1.5% of total world electricity demand and surged by 17% in 2025, with AI-focused facilities growing substantially faster than the average. The IEA projects 650–1,050 TWh by 2026, a range whose upper bound exceeds the total electricity consumption of most G20 economies.
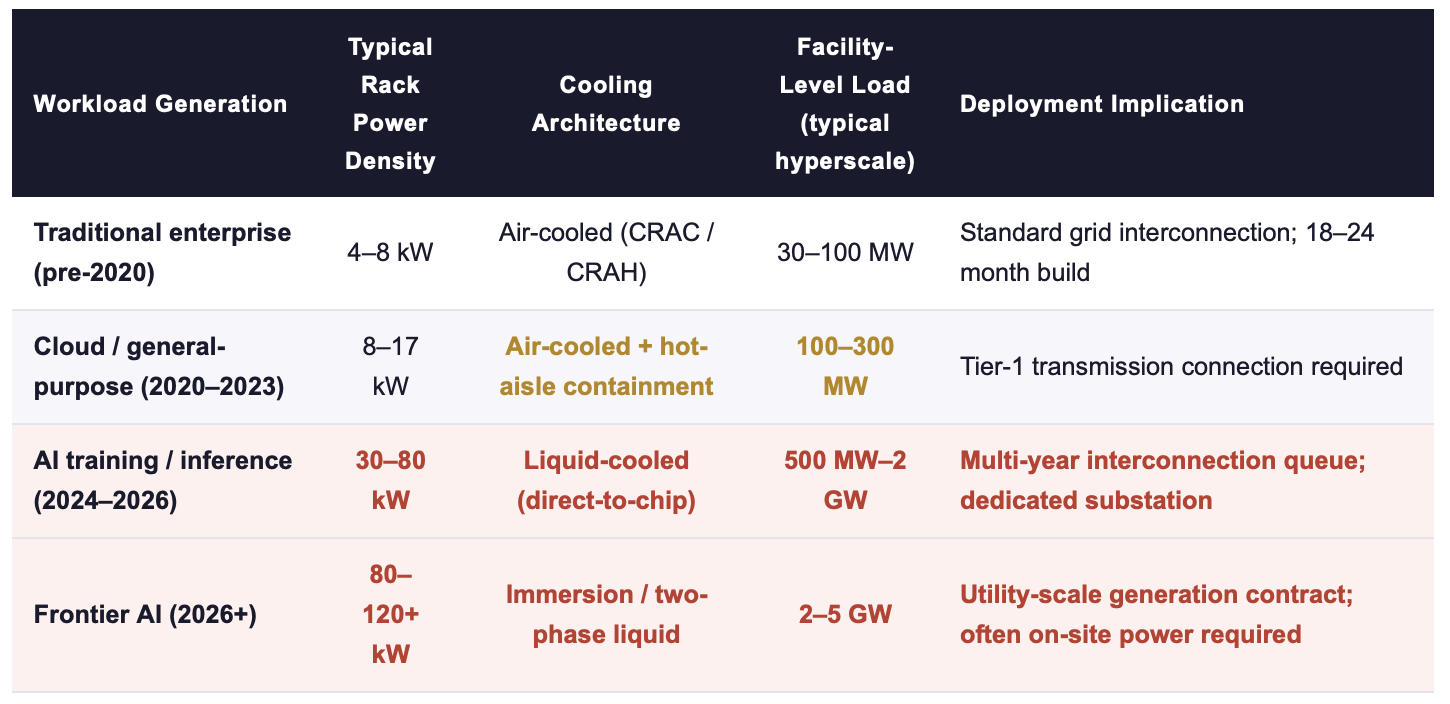
A single hyperscale AI campus now demands 1–5 GW of firm, continuous power, equivalent to the load of several hundred thousand households or a mid-size industrial city. Rack power density has moved from 8–17 kW (traditional) to 30–120+ kW (AI training), compressing a full thermal and electrical redesign into a 24-month deployment window.
Capital expenditure by major tech firms exceeded USD 400 billion in 2025, with further growth of roughly +75% projected for 2026. Yet grid connection delays, transformer supply shortages, and multi-year permitting queues are now the binding constraint on how much of that Capex can actually be deployed. Power, not compute, is deciding the competitive outcome.
1. The Scale of the Energy Shift: From Facility Input to Binding Constraint
The transition from traditional enterprise compute to AI-scale infrastructure is not a gradual scaling of existing patterns. It is a discontinuity, in power density, in electrical architecture, in thermal management, and in the way site decisions are made. The numbers make the discontinuity unavoidable: over a span of roughly five years, rack-level power consumption has moved from figures that a conventional data center was designed around, to figures that demand a fundamentally different facility.
Sources: LBNL 2024 United States Data Center Energy Usage Report; Gartner (November 2025); IEA Energy and AI Report (2025); industry benchmarks 2024–2026.
The US alone consumed approximately 176–183 TWh of electricity in data centers during 2023–2024, around 4.4% of national electricity demand. LBNL's 2024 projection places US data center consumption at 325–580 TWh by 2028, or 6.7–12% of national electricity. The lower bound represents roughly a 75% increase over the 2024 baseline in four years. The upper bound represents more than a tripling. Neither scenario is compatible with the pace at which new generation capacity is being added to the grid through conventional planning processes.
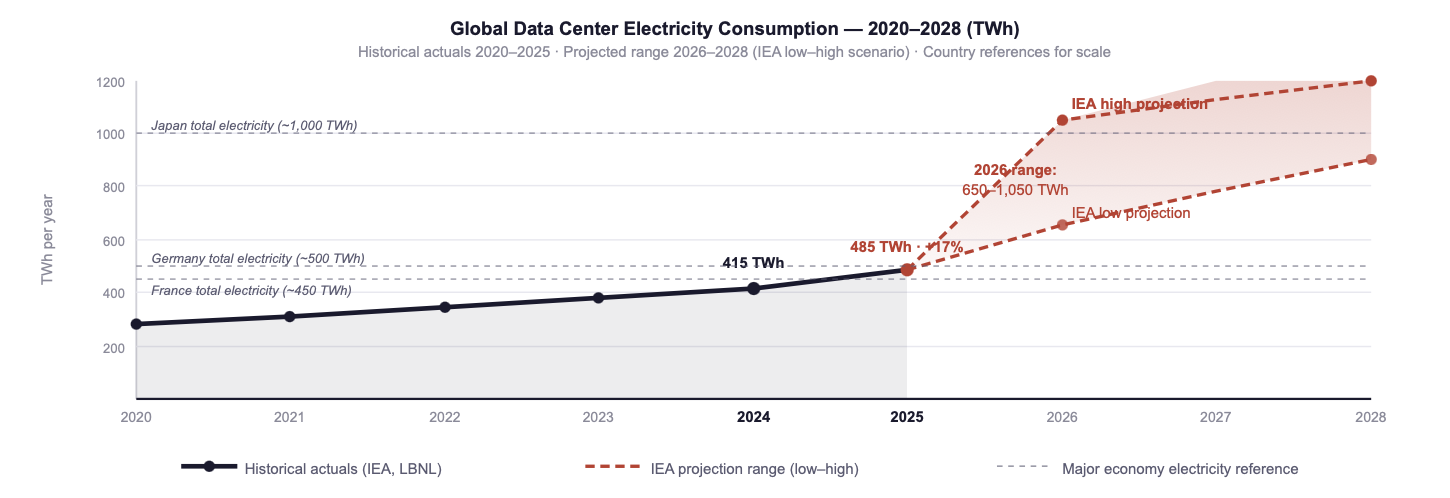
Fig. 1: Global data center electricity consumption 2020–2028. The 2024 actual (415 TWh) already exceeded the entire electricity consumption of France. The IEA high scenario for 2026 (1,050 TWh) exceeds the total electricity consumption of Japan. Sources: IEA Energy and AI Report (2025); IEA "Data centre electricity use surged in 2025" (April 2026); LBNL (2024); own compilation.
👉 Key Insight: The bottleneck has moved from silicon innovation to power availability, grid connection capacity, and total energy economics. A company that has secured 2 GW of firm power for a frontier AI campus today has a structural competitive advantage that a company with better chips but no grid connection cannot close in less than 3–5 years, the typical timeline for a new utility-scale interconnection.
2. Why Energy Now Defines AI Progress: The Capex–Grid Paradox
The scale of committed capital in AI infrastructure is historically unprecedented. Capital expenditure by the largest technology firms exceeded USD 400 billion in 2025, with analysts projecting further growth of approximately +75% for 2026. For context, that single-year 2026 Capex level would exceed the combined annual capital investment of the entire global aviation industry and most national infrastructure programmes.
Yet the binding constraint on how much of this Capex can actually produce live, operating capacity is not money. It is grid access. The critical mismatch is between three timelines that have become fundamentally incompatible: the 12–18 months in which an AI facility can be designed and built, the 36–60 months required for a new transmission interconnection in most major markets, and the 60–96 months typical for new utility-scale generation. Capital that arrives faster than power cannot be deployed. Capital that waits for power is no longer first to market.
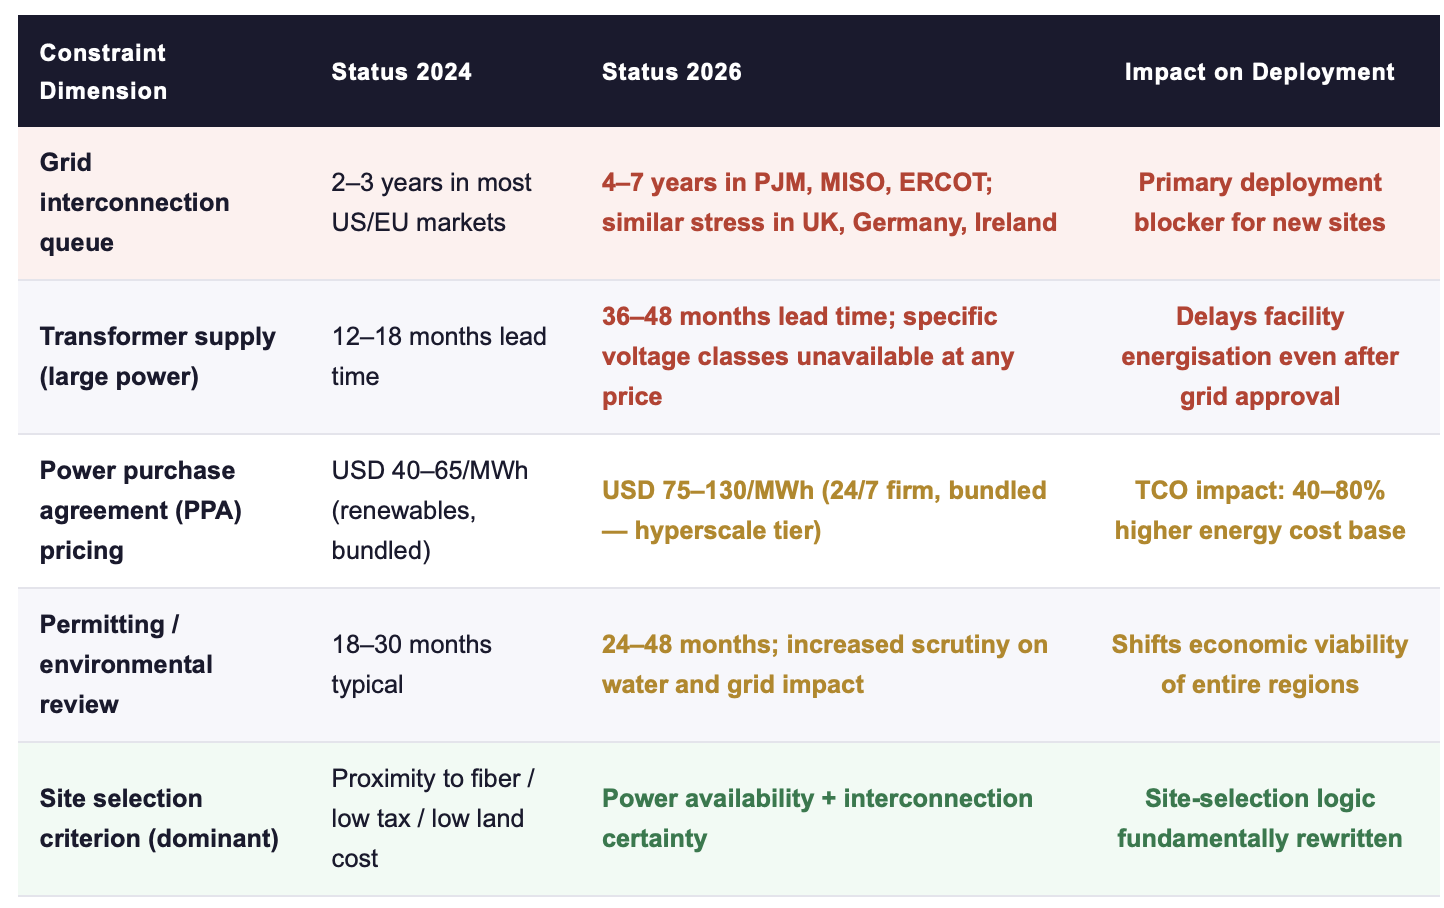
Sources: Gartner (November 2025); McKinsey "The cost of compute" (2025); US EIA interconnection queue data 2025; industry benchmarks for PPA pricing Q1 2026.
The commercial consequence of this constraint stack is a re-ordering of which companies scale fastest. The determining variable has shifted from technology portfolio to power portfolio: forward PPAs, behind-the-meter generation capacity, grid interconnection agreements in execution, and operational efficiency at the watt level. Firms that built energy procurement capabilities two to three years ago, often dismissed as over-cautious or over-engineered at the time, are now the firms scaling AI capacity at multiples of what their technology-portfolio peers can achieve.
👉 Key Insight: Capital expenditure in AI infrastructure is running approximately 3–4× faster than new grid capacity is being added in the major data center markets. That ratio cannot continue indefinitely. Either the Capex moves to where power is available (on-site generation, emerging markets, stranded renewables), or a significant fraction of the committed Capex will not be deployed. Both outcomes reward companies that have already embedded energy strategy into core capital allocation.
3. Three Scenarios: Quantifying the Strategic Outcome
The following three scenarios frame the strategic choice available to operators today. They are not forecasts. They are the three patterns observable in the 2025–2026 Capex cohort, differentiated by how each group treats energy as a strategic variable.
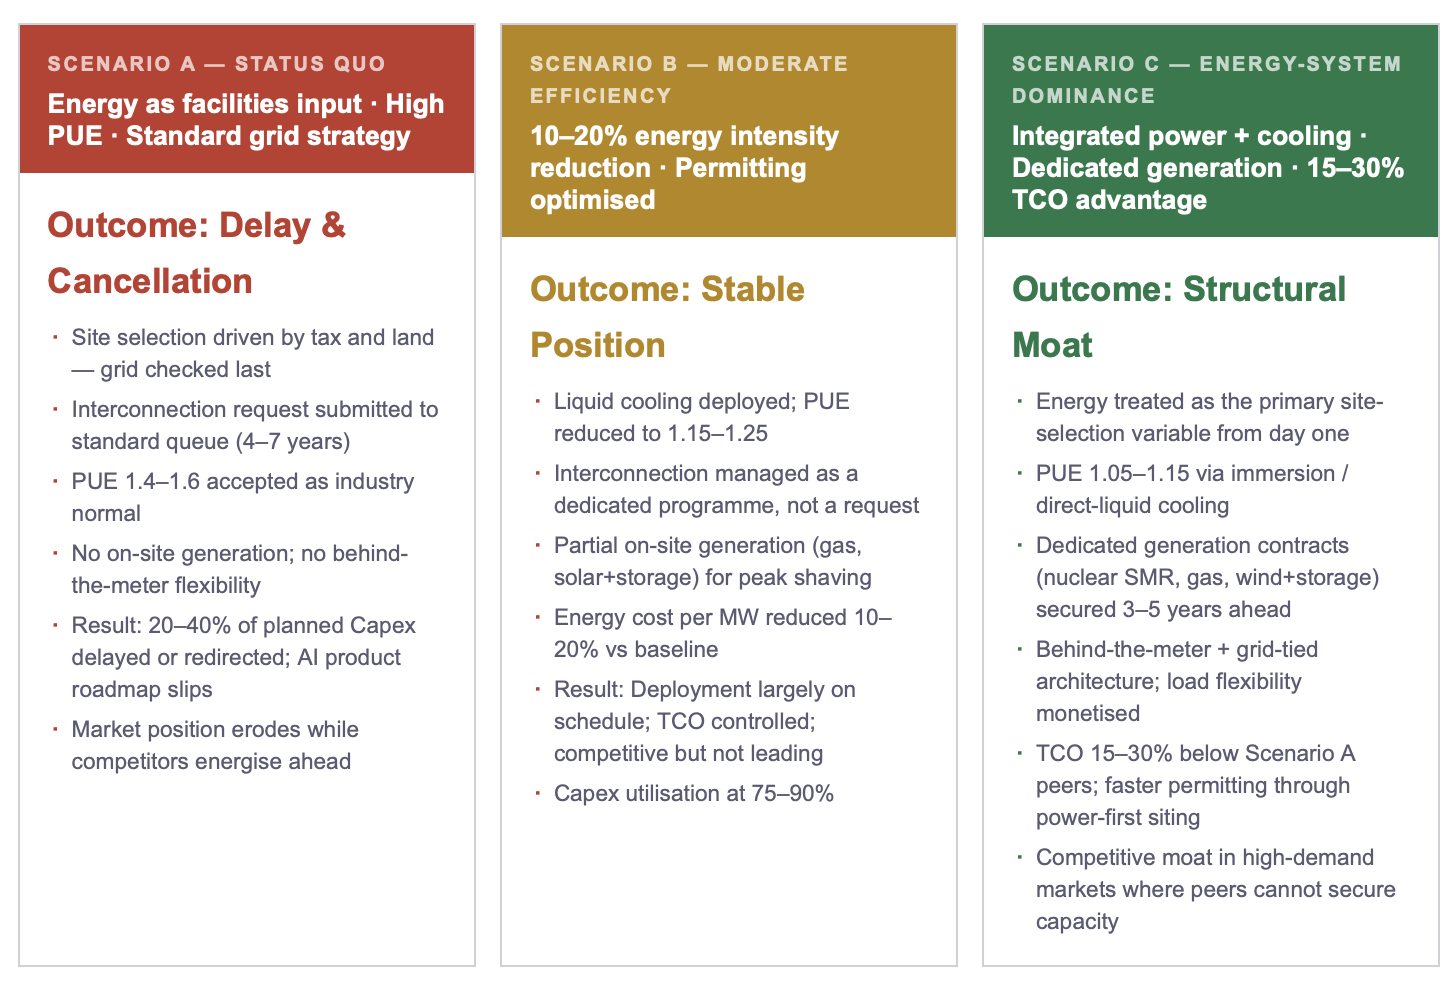
The three scenarios are not equally accessible. Scenario C requires decisions made 24–36 months in advance of deployment, generation contracts negotiated before the AI Capex decision is even on the board agenda, cooling architecture specified before GPU orders are placed, and site selection logic rebuilt around a power-first framework rather than a cost-first framework. The companies currently in Scenario C are those that treated the 2023–2024 period as the window for structural positioning. The window for the 2027–2028 cohort is 2026.
👉 Key Insight: The TCO spread between Scenario A and Scenario C on a hyperscale AI campus is not measured in percentage points of operating budget. On a 1 GW campus with a 10-year operating horizon, the spread is measured in billions of dollars of cumulative total cost, and in the strategic question of whether the AI product roadmap can be executed at all. Energy-system thinking is no longer an efficiency optimisation. It is the capital strategy.
4. Executive Action Plan: Four Commitments for the 2026 Cycle
ACTION RECOMMENDATIONS
IMMEDIATE MEASURES (0–90 DAYS)
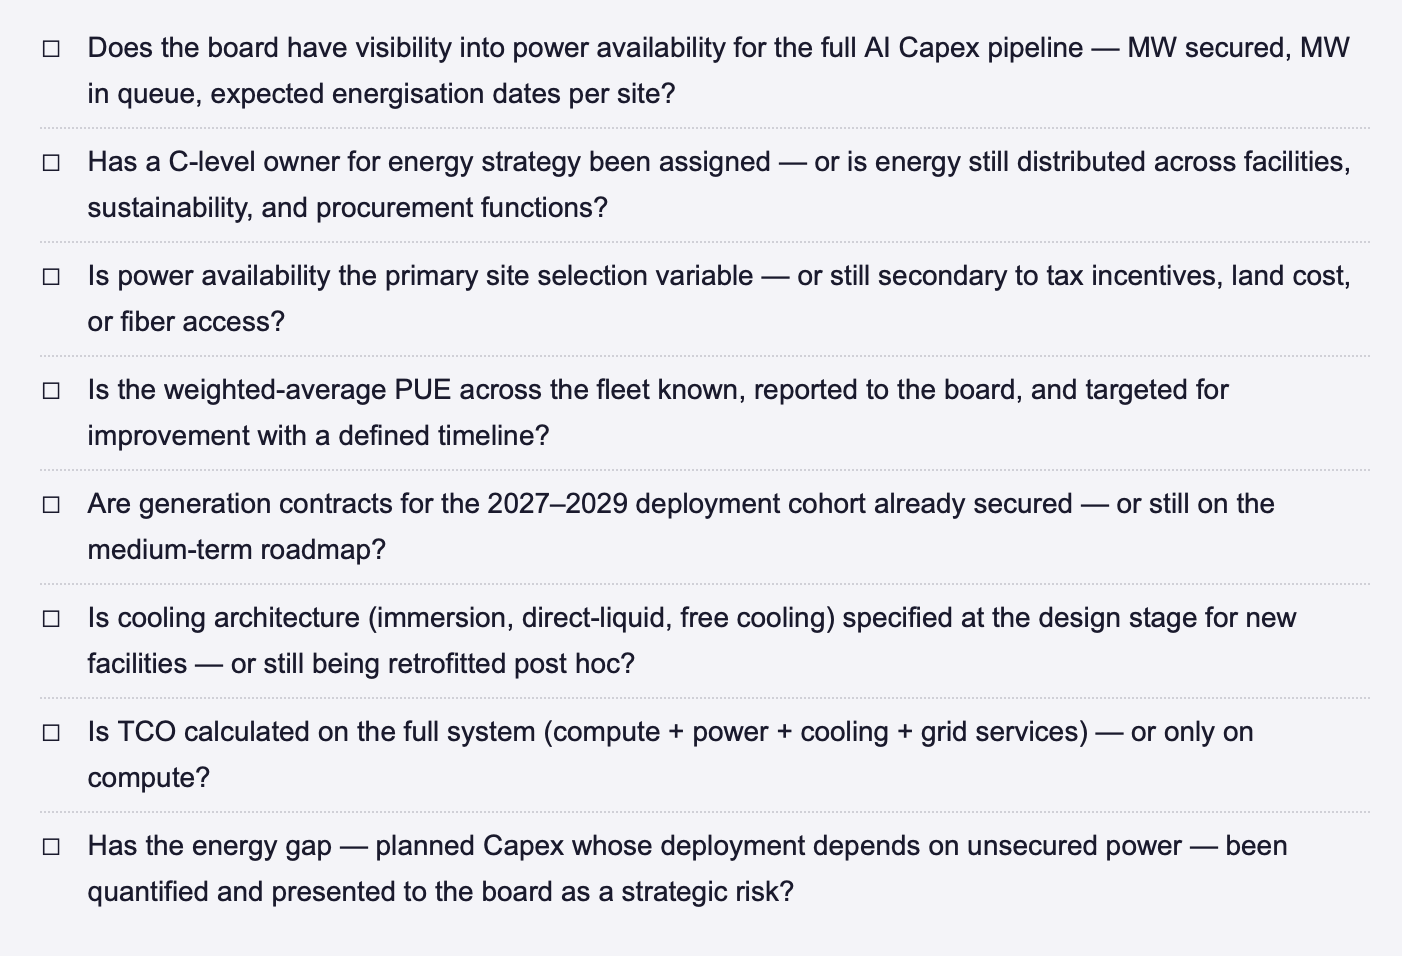
Commission an energy exposure audit of your current and planned AI infrastructure: how many MW are under firm contract, how many are in interconnection queue, and what is the expected energisation date for each?
Identify the energy gap: the volume of planned AI Capex whose deployment depends on power that is not yet secured. This is the single most important number for executive briefing in 2026, and it is usually unknown inside the organisation.
Assess PUE and cooling architecture across the deployed fleet: what is the weighted average PUE, and what would the effective compute gain be from a 0.1 reduction? Translate this into compute-equivalent capacity.
Map transmission congestion and interconnection queue status across your top three target regions, the data exists in US FERC and EU regulator filings but is rarely consolidated into a site-selection input.
STRATEGIC COMMITMENTS (6–24 MONTHS)
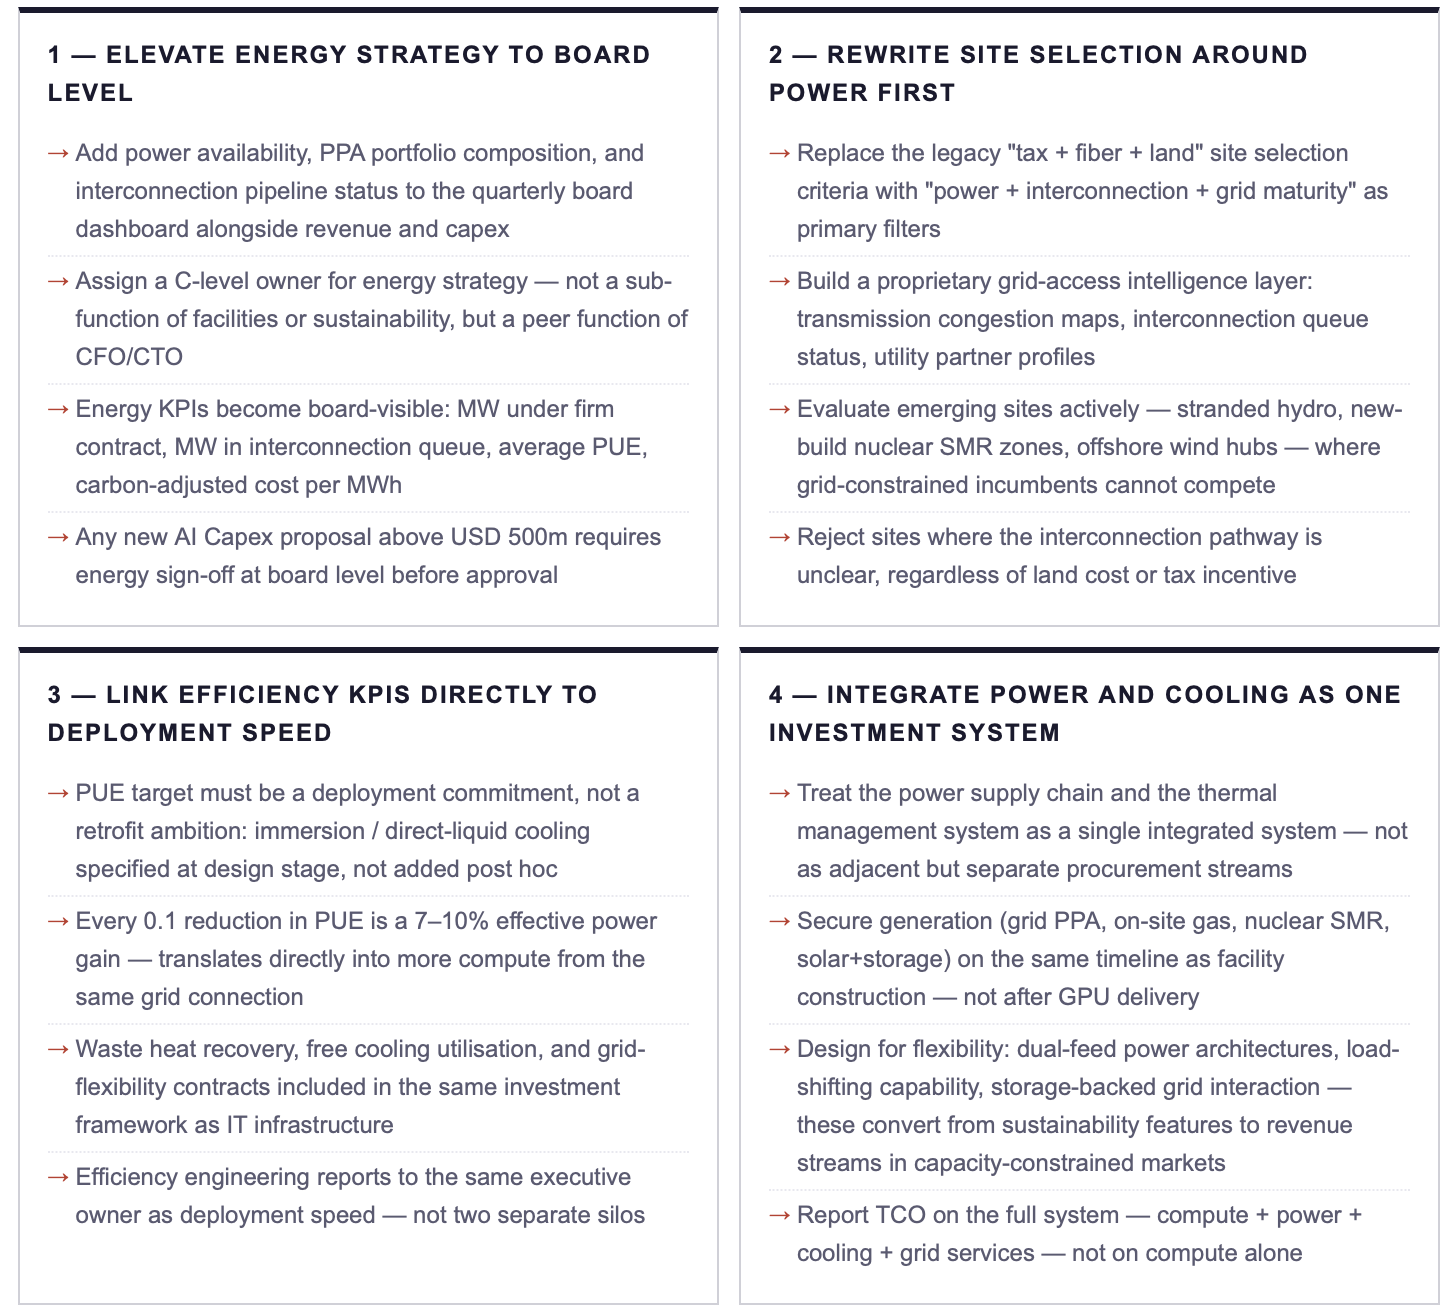
Establish a dedicated energy strategy function at C-level with authority over site selection, PPA portfolio composition, and interconnection pipeline, reporting directly to the CEO, peer to CFO and CTO.
Lock forward generation contracts for the 2027–2029 deployment cohort today, the lead time on utility-scale PPAs for firm, 24/7 power is now 24–36 months in major markets, and the 2027 cohort window is already closing.
Mandate integrated power + cooling design for all new deployments: no AI campus proposal advances to investment committee without a documented target PUE below 1.2 and a defined thermal architecture.
Build partnerships with utilities, independent power producers, and on-site generation developers, energy sourcing is now a strategic procurement function with the same weight as semiconductor supply relationships.
ENERGY DOMINANCE CHECKLIST: STRATEGIC QUESTIONS FOR THE NEXT BOARD MEETING
FINAL THOUGHT
A decade ago, the winners in digital infrastructure were the companies with the best software architectures. Five years ago, they were the companies with the best chips. Today, they are the companies that secured the gigawatts. The technology case for AI has been made. The financing case has been made. The compute case has been made. What remains is the energy case, and it is the one that most executive teams are least equipped to make, because energy has lived in facilities, sustainability, and procurement silos that were designed for a different era. The boards that restructure their governance to put energy at the centre of AI strategy will lead the 2027–2030 cycle. The boards that do not will spend the next four years explaining why their committed Capex is not producing operating capacity.
Where does energy strategy currently sit in your organisation, as a facilities function, a sustainability function, or a board-level capital allocation discipline? Connect for a direct exchange or share your current framework. | Next in Week 18: Part II delivers the strategic response framework, the leadership commitments that translate AI infrastructure investment into competitive advantage in a power-constrained market.
Note: This article reflects my personal views based on industry experience and publicly available information. It does not constitute professional, legal, or investment advice and does not represent the views of my employer.
REFERENCES
Gartner (2025) Forecast: Data Center Infrastructur, Worldwide Power and Capacity Trends. Stamford, CT: Gartner. November 2025.
IEA (International Energy Agency) (2025) Energy and AI: How the Rise of AI Is Transforming Global Energy Systems. Paris: IEA.
IEA (International Energy Agency) (2026) Data centre electricity use surged in 2025. Paris: IEA. April 2026.
LBNL (Lawrence Berkeley National Laboratory) (2024) 2024 United States Data Center Energy Usage Report. Berkeley, CA: US Department of Energy.
McKinsey & Company (2025) The cost of compute: AI infrastructure economics in a capacity-constrained era. New York: McKinsey Global Institute.
© René Grywnow, DBA · Strategic Intelligence Brief · April 2026 Energy Dominance · Week 18, Part I