The Hidden Infrastructure Behind AI Growth
ENERGY DOMINANCE · WEEK 19, PART I · APRIL 2026
Why Holistic System Optimisation Determines Success Beyond Raw Compute Power
Data Center Infrastructure | Power + Cooling Systems | Strategic Intelligence Brief | René Grywnow, DBA
The AI industry measures progress in FLOPs, parameters, and benchmark scores. The infrastructure that delivers those numbers runs on a different physics: watts, joules, and degrees Celsius. For every dollar spent on GPUs, between forty and sixty cents is consumed by the systems that power and cool them, and in most facilities currently operating, a significant fraction of those support-system dollars is wasted through exactly the same mechanisms that waste energy in any industrial system: fixed-speed operation, throttling control, legacy architectures designed for a different thermal load, and organisational silos that prevent integrated optimisation. The GPU gets the headline. The power and cooling system determines whether the headline is economically sustainable.
EXECUTIVE SUMMARY
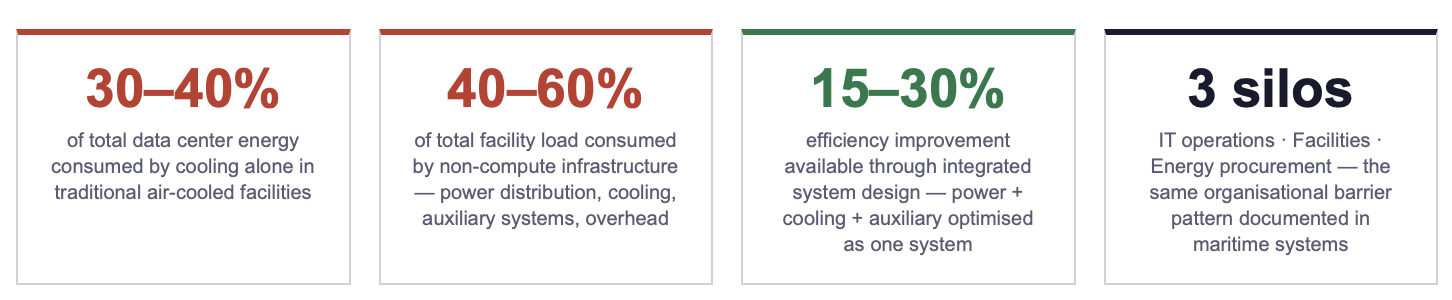
Cooling alone consumes 30–40% of total data center energy in traditional air-cooled facilities, and accounts for up to 75% of the non-IT "overhead" load. At AI-scale rack densities (30–120+ kW), air cooling reaches physical limits and the cooling energy fraction rises further unless fundamentally different thermal architectures are deployed.
Combined with power distribution losses (transformers, UPS, PDU conversion), auxiliary systems (pumps, fans, humidification), and facility overhead (lighting, security, monitoring), hidden infrastructure consumes 40–60% of total facility electrical load at partial or high-density operation, delivering zero compute output while consuming grid-connected power.
The real enabler of AI growth is not more GPUs. It is the integrated design of power delivery, thermal management, and auxiliary systems as a single optimised system, exactly the logic that the maritime efficiency series documented for vessel auxiliary systems. The parallel is structural, not metaphorical: the same physics (Affinity Laws, system integration effects, VFD economics) applies in both domains. The next 15–30% efficiency frontier in data center infrastructure is system-level integration, not component-level upgrade.
1. Mapping the Hidden Energy Consumers: Where the Power Actually Goes
The Power Usage Effectiveness (PUE) metric captures the ratio of total facility energy to IT equipment energy. A PUE of 1.0 means every watt entering the facility powers compute. A PUE of 1.6 means 60% additional energy is consumed by non-IT infrastructure for every watt of compute delivered. The global average PUE for data centers remains approximately 1.55–1.60, meaning that for a 100 MW facility, 35–38 MW is consumed by infrastructure that delivers zero compute output. At hyperscale AI densities, this translates to tens of millions of dollars per year in energy expenditure producing no revenue-generating work.
The following table disaggregates the non-IT load by system, mapping where the hidden energy consumers sit in a typical 100 MW facility and what drives the loss in each system.
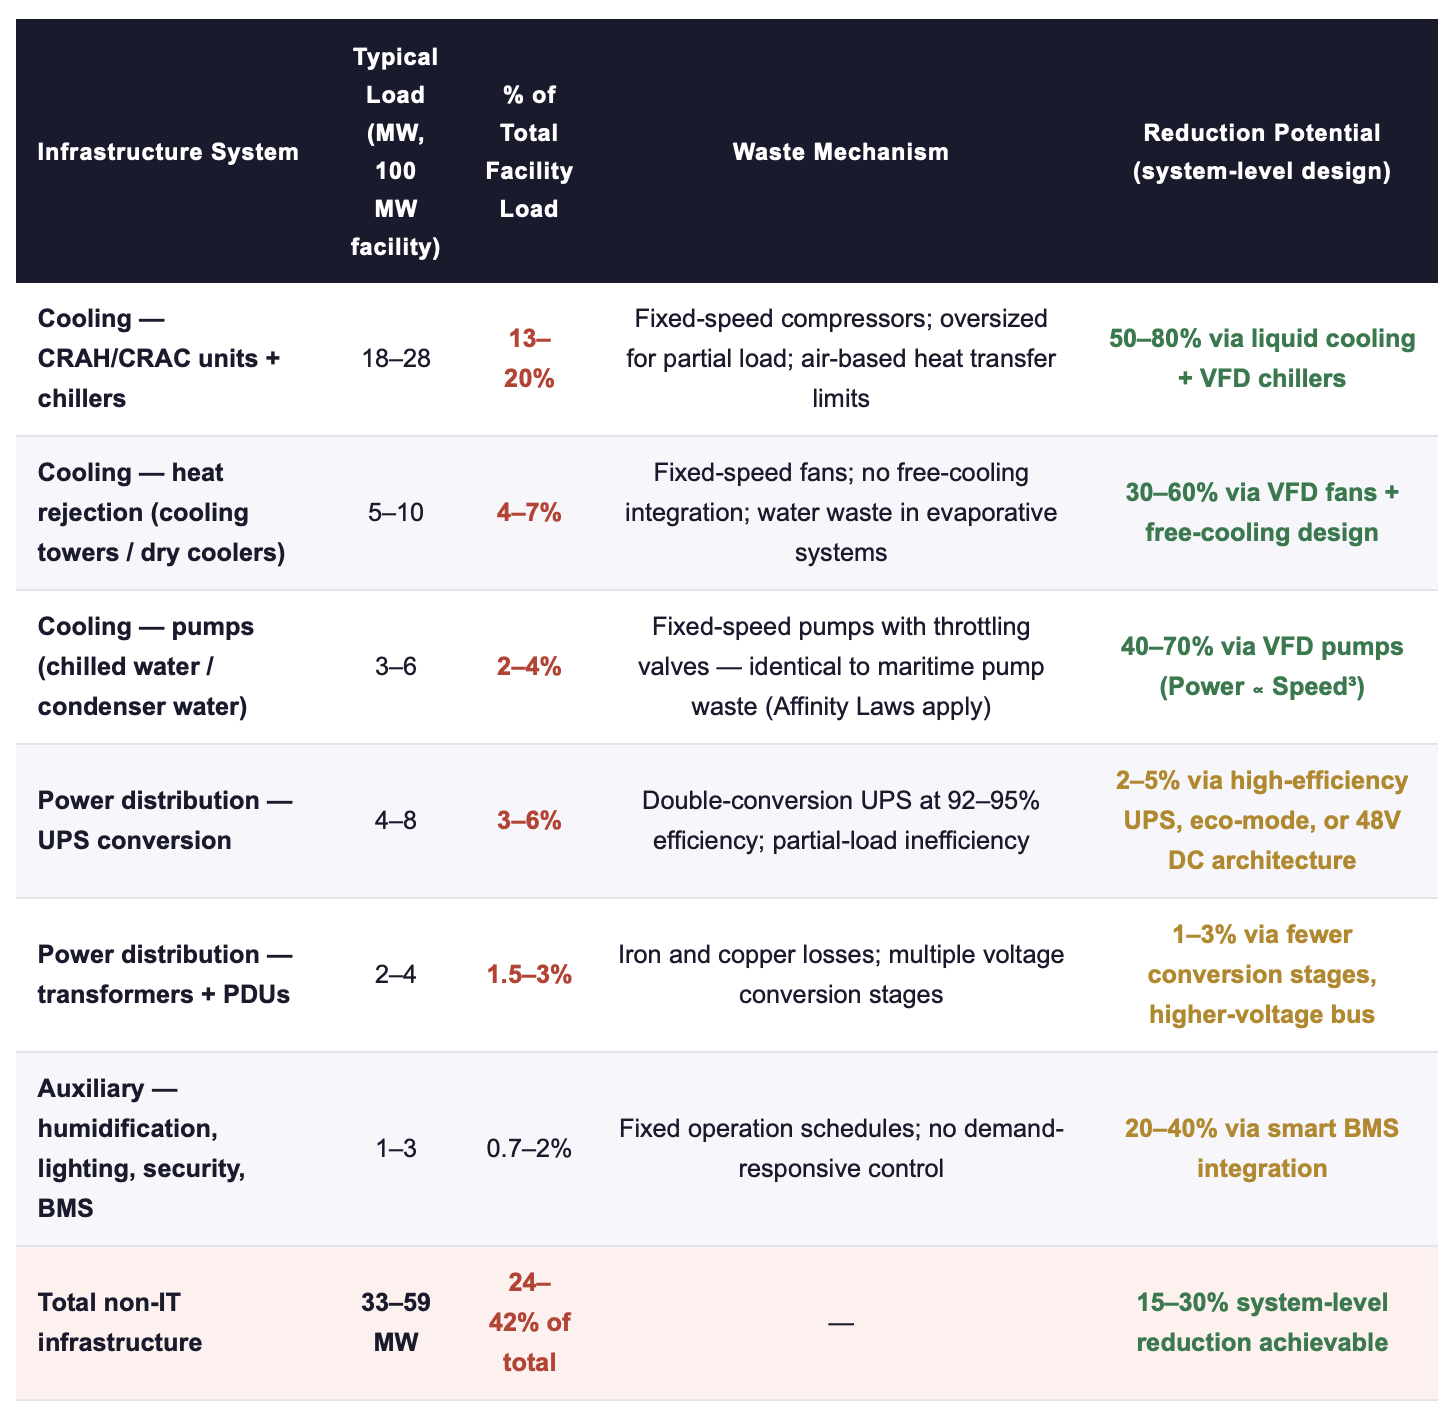
Sources: IEA Energy and AI Report (2025); Tom's Hardware Data Center Cooling State of Play (2025); ScienceDirect AI-driven cooling optimisation review (2025); Uptime Institute Annual Survey 2025; industry benchmarks for 100 MW Tier III/IV facility at PUE 1.55.
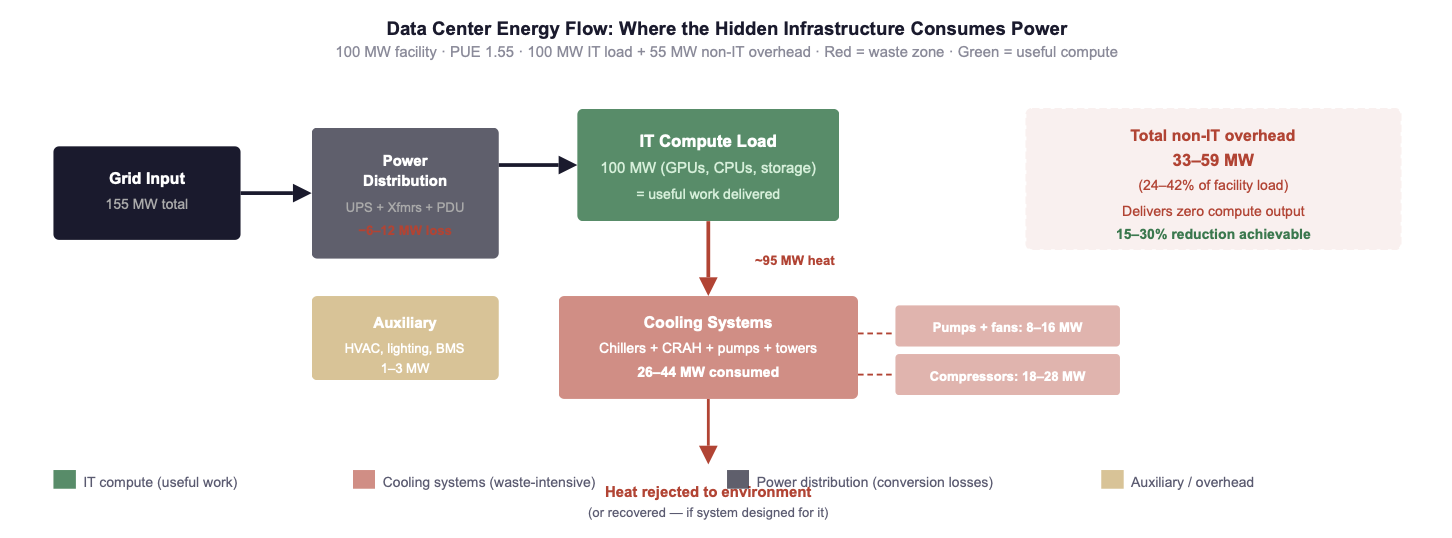
Fig. 1: Energy flow in a 100 MW data center at PUE 1.55. Of 155 MW drawn from the grid, only 100 MW powers compute. The remaining 33–59 MW is consumed by cooling (dominant), power distribution, and auxiliary systems, delivering zero compute output. Cooling pumps and fans follow the same Affinity Laws documented in the maritime series: VFD retrofit delivers 40–70% savings on these circuits. Sources: IEA (2025/2026); Tom's Hardware (2025); Uptime Institute (2025).
The parallel to the maritime auxiliary system waste mapped in the Efficiency Before Fuel series (Week 2, Part IV and Week 3, Part III) is structural, not cosmetic. In both domains, the dominant waste mechanism is identical: centrifugal loads (pumps, fans, compressors) operated at fixed speed with throttling or bypass control, consuming full power regardless of actual demand. In both domains, the Affinity Laws guarantee that variable-speed operation delivers savings of 40–70% on these circuits. In both domains, the reason the waste persists is not technology, it is organisational: the teams that own the cooling infrastructure do not share KPIs with the teams that own the compute infrastructure, and the team that owns the electricity bill has no authority over either.
👉 Key Insight: AI growth is exposing decades of siloed infrastructure thinking. The same centrifugal-load waste that costs maritime operators USD 225–484k per vessel per year costs data center operators millions per facility per year, through identical physics, identical control failures, and identical organisational silos. System-level integration is the next 15–30% efficiency frontier in both industries. The technology is the same. The barrier is the same. The solution is the same.
2. Root Causes of Inefficiency: Three Structural Barriers
The root cause analysis follows the same diagnostic framework used in the maritime series (Week 3, Part III): the barriers to system-level efficiency in data centers are not technological. They are architectural (legacy design), mechanical (fixed-speed control), and organisational (silo structure). Each barrier reinforces the others.
BARRIER 1: ARCHITECTURAL: AIR-COOLING LIMITS AT AI-SCALE DENSITY
Air cooling was designed for rack densities of 4–17 kW. At 30 kW per rack, air cooling reaches its practical ceiling; beyond 50 kW, it is physically inadequate regardless of airflow management. The consequence is that facilities designed in the air-cooling era, the vast majority of currently operating data center capacity, face a binary choice when upgrading to AI workloads: retrofit to liquid cooling (significant Capex, but captures the efficiency gain permanently) or operate air cooling at its extreme limit (marginal Capex, but locked into PUE 1.4–1.6 and unable to support racks above 30–40 kW).
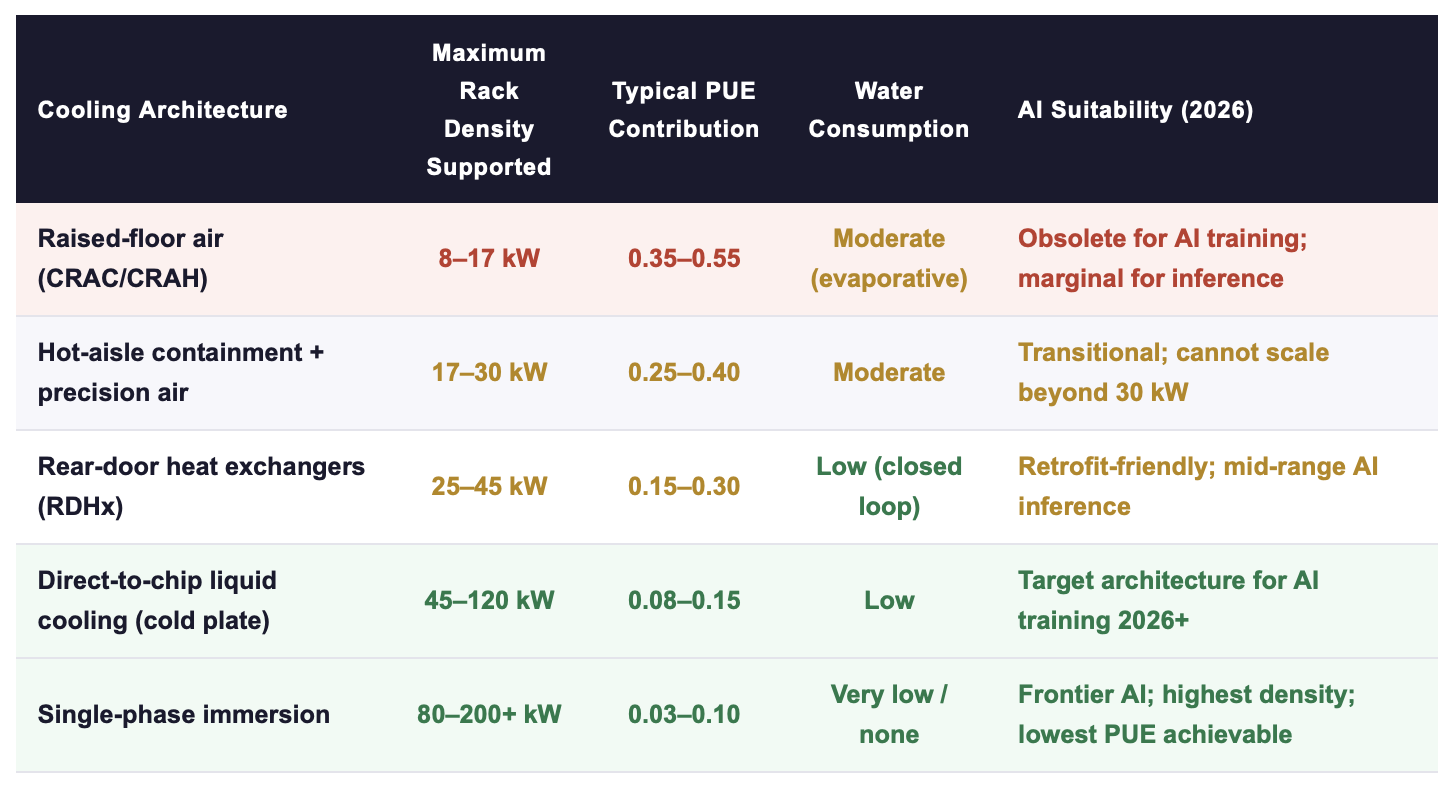
Sources: Tom's Hardware Data Center Cooling State of Play (2025); ScienceDirect AI-driven cooling optimisation review (2025); IEA (2025); vendor specifications (GRC, Asetek, CoolIT, Iceotope). PUE contribution = cooling system's share of total PUE overhead.
BARRIER 2: MECHANICAL: FIXED-SPEED CONTROL ON EVERY MAJOR CIRCUIT
The second barrier is the direct analogue of the maritime pump-system waste documented in Week 2, Part IV. Cooling pumps, chiller compressors, cooling tower fans, and CRAH fan units in most data centers currently operate at fixed speed with throttling or bypass control. The Affinity Laws apply with equal force: at 60% of rated flow, a fixed-speed pump consumes 92% of full-speed power; a VFD-controlled pump consumes 22%. The difference is waste, dissipated as heat, which then requires additional cooling energy to reject.
The compounding effect in data centers is more severe than in maritime applications because the waste heat generated by fixed-speed cooling infrastructure must itself be cooled, creating a recursive loop where inefficiency in the cooling system generates additional load on the cooling system. Every kilowatt of pump and fan waste becomes approximately 1.3–1.5 kW of total system load once the secondary cooling effect is included.
BARRIER 3: ORGANISATIONAL: THREE SILOS, THREE INCOMPATIBLE KPIS
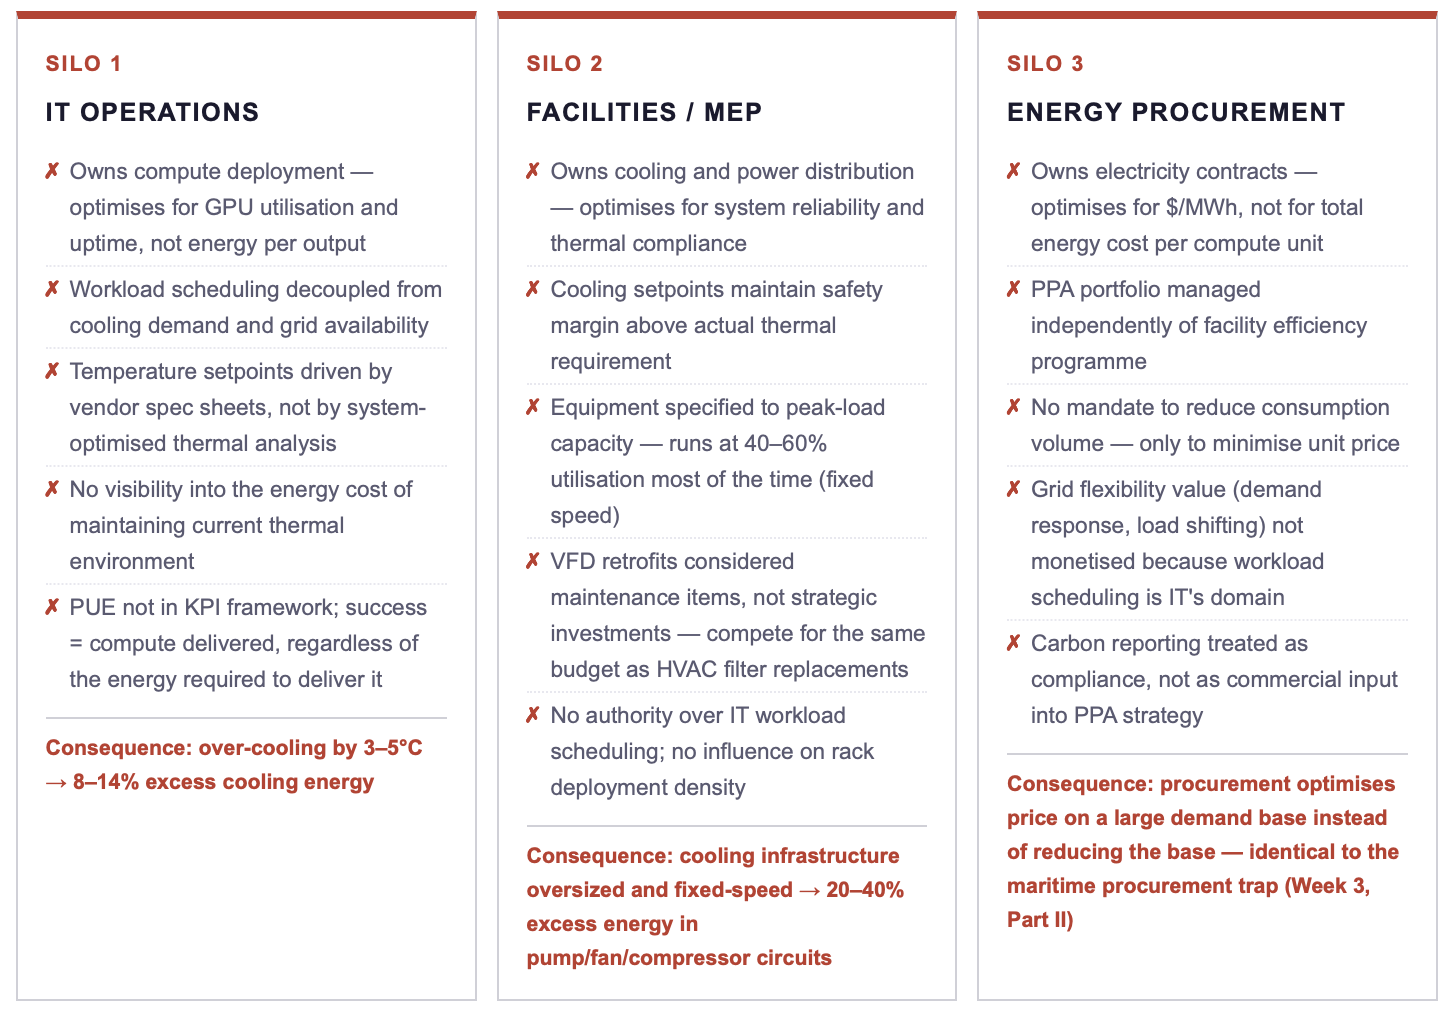
👉 Key Insight: The three-silo structure in data centers is functionally identical to the three-silo structure in maritime energy management: different functions own different pieces of the same energy system, with incompatible KPIs and no shared metric. IT cares about uptime; facilities cares about thermal compliance; procurement cares about price per MWh. None measures total energy cost per useful compute output, the metric that would align all three functions toward the same efficiency outcome.
3. Evidence from 2025–2026 Deployments: What Works When Systems Are Integrated
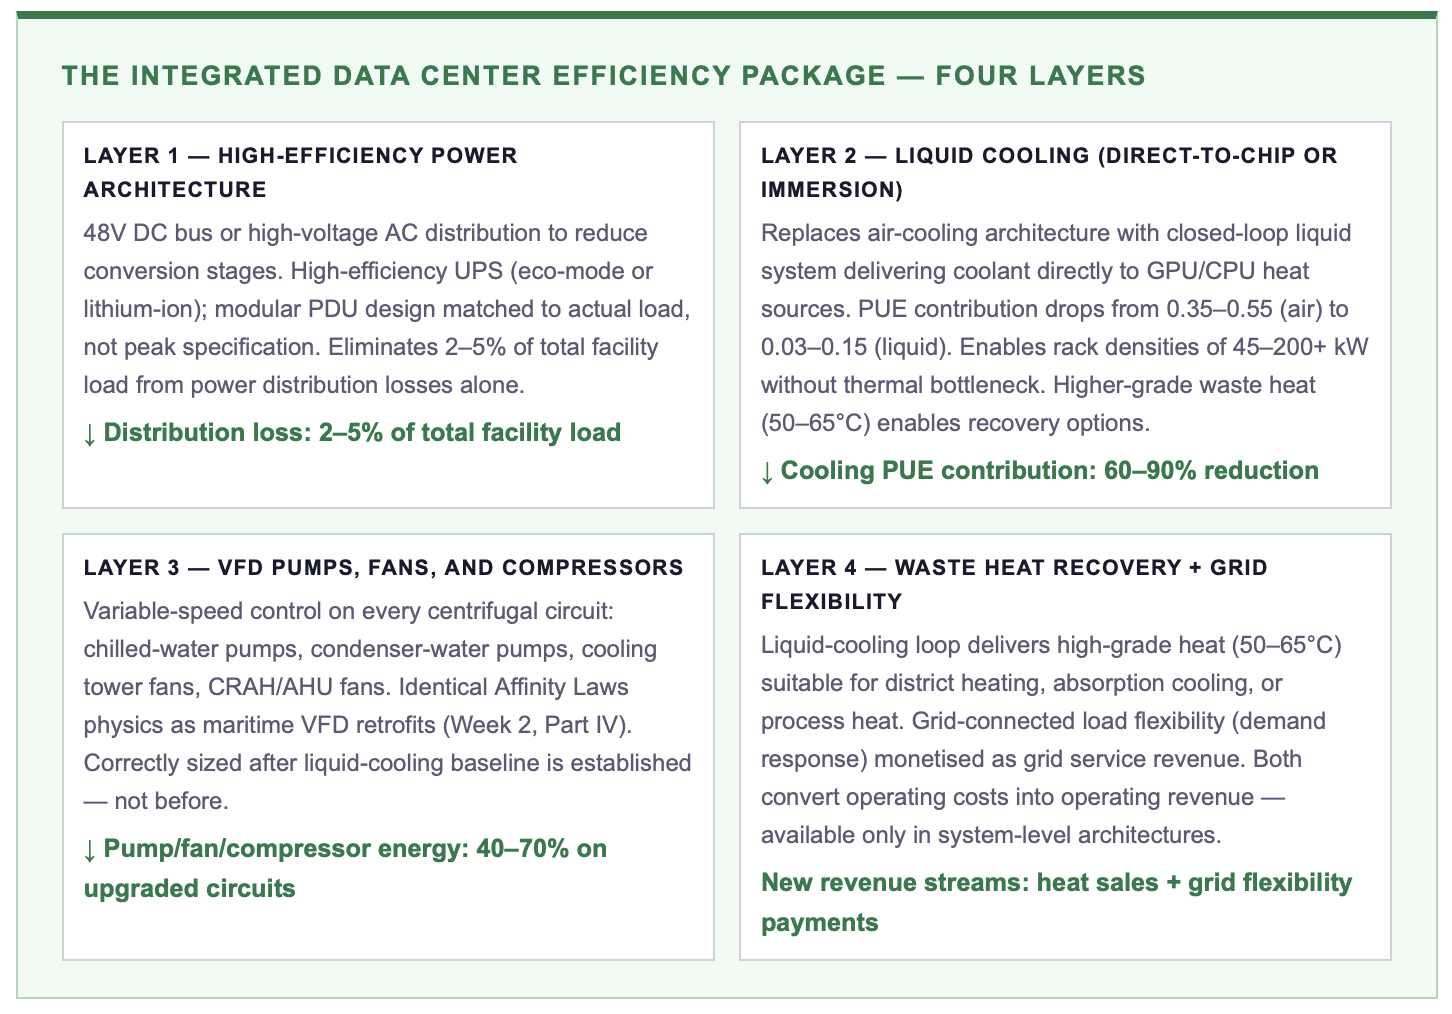
The IEA's April 2026 report and the ScienceDirect review of AI-driven cooling optimisation (2025) both converge on a finding that mirrors the maritime system-integration evidence documented in Week 3, Part III: component-level cooling upgrades achieve real but limited efficiency gains. System-level integration, where cooling architecture, power distribution, and workload management are designed or retrofitted as a single optimised system, delivers gains that exceed the sum of the components by 20–35%.

Sources: IEA Energy and AI Report (2025); ScienceDirect AI-driven cooling optimisation review (2025); BCG/McKinsey data center infrastructure analyses (2025); vendor case studies (GRC, Asetek, Vertiv, Schneider Electric). TCO at average US commercial electricity rate ~$85/MWh.
👉 Key Insight: The 3–4× TCO multiplier from system-level integration versus component-level upgrade is the data center equivalent of the 47% NPV premium documented for maritime system integration (Week 3, Part III). The mechanism is the same: correct sizing across circuits, inter-system cascade effects (reduced cooling load → reduced pump load → reduced fan load → reduced secondary cooling), and unified measurement that enables continuous optimisation. Component-level thinking forfeits this multiplier permanently.
4. The System-Level Solution Framework
5. Breaking the Silos: Unified Efficiency Governance for Data Centers
The governance framework required is structurally the same as the one documented for maritime operations (Week 3, Part III and Week 4, Part I): a shared energy metric, total energy cost per useful compute unit delivered, that replaces the three incompatible silo metrics (uptime for IT, thermal compliance for facilities, $/MWh for procurement) with a single number all three functions contribute to and are measured against.
The specific implementation requires three changes. First, a unified pre-deployment review process: IT, facilities, and energy procurement must jointly scope every new deployment and every major retrofit, with PUE target, cooling architecture, and power strategy reviewed as a single system, not as three separate budgets. Second, workload scheduling must integrate with cooling and grid signals: AI training runs that can be shifted to low-demand hours, or to periods when free-cooling conditions are optimal, reduce both cooling energy and electricity cost simultaneously, but only if the scheduling function has visibility into the cooling and grid systems. Third, efficiency engineering must report to the same executive owner as deployment speed, because every kWh saved through better cooling is a kWh available for additional compute on the same grid connection.
ACTION RECOMMENDATIONS
IMMEDIATE MEASURES (0–90 DAYS)
Commission a facility-level energy flow audit: map every non-IT system (cooling, power distribution, auxiliary) against current control mode and operating point, quantify the total overhead in MW and annual USD, disaggregated by system, using the methodology in Fig. 1.
Run a governance test: ask three people, your head of IT operations, your facilities director, and your energy procurement lead, what the total energy cost per GPU-hour was for your highest-consumption facility last quarter. If they give three different numbers (or no number), the silo structure is confirmed.
Identify the VFD opportunity: which cooling pumps, fans, and compressors are currently operating at fixed speed with throttling or bypass control? The Affinity Laws guarantee 40–70% savings on these circuits, the same physics documented in the maritime series.
Assess cooling architecture readiness for the next density step: if your facility cannot support 60+ kW racks without air cooling, the architectural ceiling will bind within 12–18 months. The liquid-cooling design decision must be made before the GPU procurement decision.
STRATEGIC COMMITMENTS (6–24 MONTHS)
Establish a unified efficiency governance framework: total energy cost per useful compute unit as the shared KPI across IT, facilities, and energy procurement. Review monthly at executive level. Link to deployment speed, not just to sustainability reporting.
Mandate system-level integration for all new deployments: no AI capacity expansion advances to investment committee without an integrated power + cooling + auxiliary design, with a defined PUE target below 1.2 and a documented thermal architecture suitable for the target rack density.
Integrate workload scheduling with cooling and grid signals: training-run scheduling should incorporate free-cooling availability, time-of-use electricity pricing, and grid demand-response opportunities as input variables, converting energy awareness from an operating cost into a scheduling advantage.
Evaluate waste heat recovery: if liquid cooling is deployed, model the revenue potential from district heating or process-heat supply to adjacent users. In European markets, waste-heat offtake contracts can offset 5–15% of annual facility energy cost, a revenue stream that air-cooled facilities cannot access.
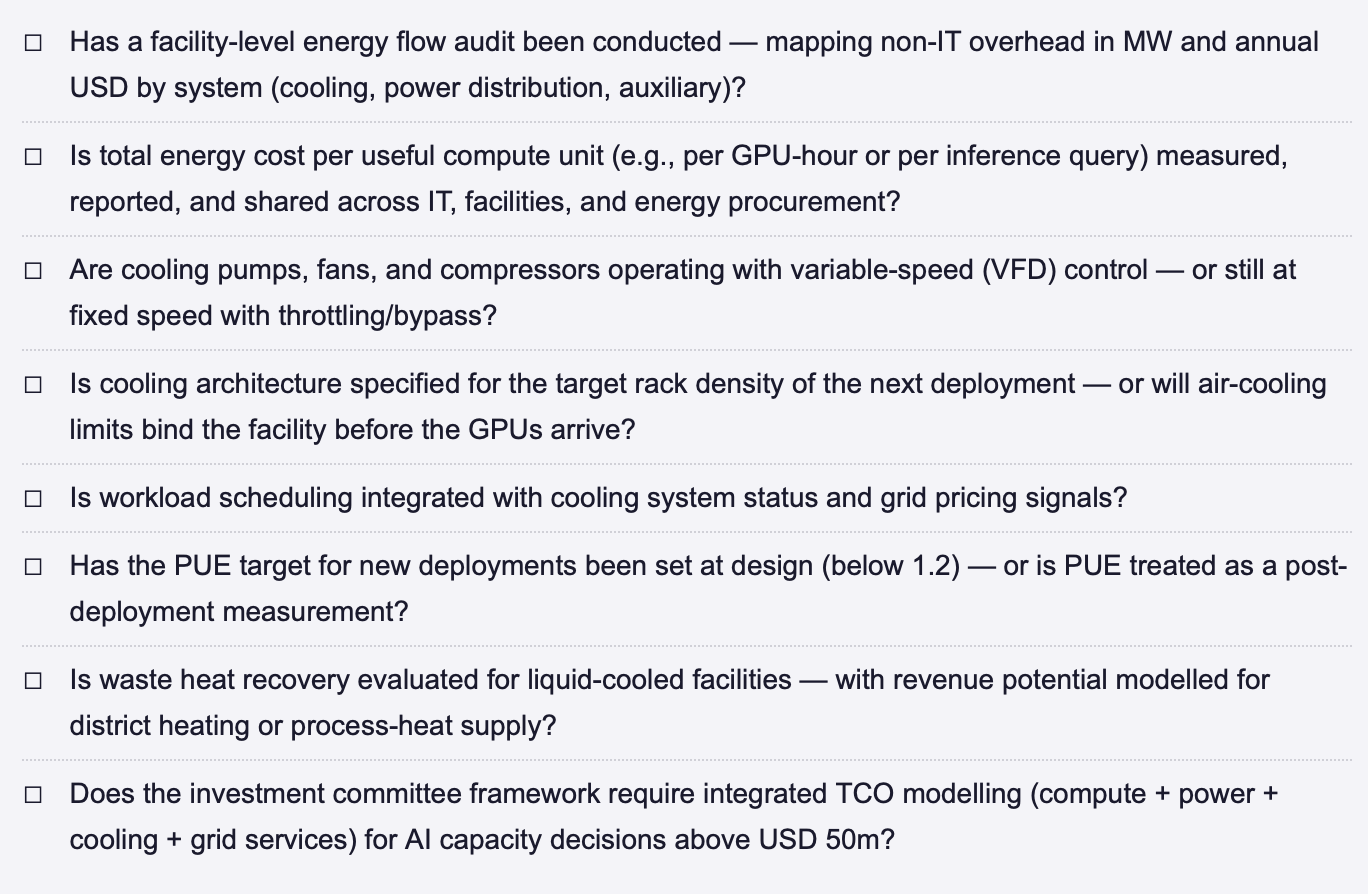
SYSTEM-LEVEL EFFICIENCY CHECKLIST, DATA CENTER INFRASTRUCTURE
FINAL THOUGHT
The AI industry has spent the past three years in a race for compute, more GPUs, faster training, larger models. The next three years will be defined by a different race: efficiency of delivery. The operators who can extract 20–35% more compute from the same grid connection, not by buying more hardware, but by eliminating the 33–59 MW of non-IT overhead that currently produces zero useful output, will set the deployment pace that compute-first competitors cannot match. The physics are known. The technology is proven. The organisational barriers are identical to those documented in maritime shipping, manufacturing, and every other energy-intensive industry that has faced the same transition from component thinking to system thinking. What differs is the timeline: in maritime, the efficiency cycle plays out over 10–15 years. In AI infrastructure, the window is 24–36 months. The companies that commit to system-level integration now will dominate the 2027–2030 cycle. The companies that continue buying more power for poorly integrated facilities will spend that cycle explaining why their Capex is not producing competitive compute.
Does your organisation measure total energy cost per GPU-hour, and is that metric shared across IT, facilities, and energy procurement? Or is energy still distributed across three functions with three incompatible metrics? Connect for a direct exchange or share your current infrastructure model. | This post opens Week 19 of the Energy Dominance series. It applies the system-level diagnostic from the maritime Efficiency Before Fuel series to AI infrastructure, revealing the same physics, the same silos, and the same integration premium.
Note: This article reflects my personal views based on industry experience and publicly available information. It does not constitute professional, legal, or investment advice and does not represent the views of my employer.
REFERENCES
IEA (International Energy Agency) (2025) Energy and AI: How the Rise of AI Is Transforming Global Energy Systems. Paris: IEA.
IEA (International Energy Agency) (2026) Data centre electricity use surged in 2025. Paris: IEA. April 2026.
ScienceDirect (2025) AI-Driven Cooling Optimisation for Data Centers: A Systematic Review of Liquid Cooling, Immersion, and Hybrid Architectures. Elsevier. 2025.
Tom's Hardware (2025) Data Center Cooling: The State of Play — Air, Liquid, and Immersion Architectures for AI-Scale Density. 2025.
BCG / McKinsey (2025) Data Center Infrastructure Economics: Operational Efficiency and System Integration Pathways. Various publications. 2025.
© René Grywnow, DBA · Strategic Intelligence Brief · April 2026Energy Dominance · Week 19, Part I