The Drydock as a Return Engine: Hardware Upgrades That Cut Fuel Costs for Good
Why the next scheduled docking could be the most important investment decision of the decade
This analysis is Part II of the Efficiency Before Fuel series. Part I (operational and regulatory measures) appeared in the previous edition.
Shipowners who treat the drydock as a compliance obligation are burning money every day, on vessels that could permanently consume 10 to 25 percent less fuel with an investment of a few hundred thousand dollars. The drydock is not a cost event. It is the most efficient investment window the maritime industry has, and most operators use it to do the minimum.
Executive Summary
A complete hardware retrofit in drydock, high-performance coating, propeller optimisation, air lubrication and energy saving devices, delivers 10 to 25% fuel savings across the full docking cycle of 2.5 to 5 years.
Payback periods for tankers, bulk carriers and container ships typically fall between two and five years; with rising EU ETS costs and FuelEU Maritime penalty exposure, this window shortens further.
Hardware upgrades are directly effective for EEXI, CII, EU ETS and FuelEU Maritime compliance, and provide the measurable, verifiable evidence that SEEMP plans require from 2026 onwards.
1. Why the Drydock Is the Right Investment Window
In drydock, the vessel is stationary, the hull fully accessible, and all work runs in parallel, with no operational interruption and no lost charter revenue. This window opens every 2.5 to 5 years. There is no better moment.
The structural advantage over operational measures such as slow steaming or voyage optimisation lies in permanence: an antifouling system or a new propeller does not deliver its savings once, it delivers them across every operating day of the following docking cycle. A bulk carrier with 300 operating days per year consuming 30 tonnes of heavy fuel oil daily saves approximately 900 tonnes of fuel annually at 10% reduction, at current prices of USD 550 to 650 per tonne, that equates to USD 495,000 to 585,000 annually, before accounting for reduced EU ETS costs.
The regulatory relevance is immediate: EEXI and CII are calculated on the basis of measurable energy consumption. Hardware retrofits that permanently reduce specific fuel consumption improve both indices directly. Unlike documented operational optimisations, physical retrofits are verifiably certifiable by DNV, Lloyd's Register and Bureau Veritas, a factor of growing importance in SEEMP Part III submissions and EU ETS reporting.
👉 Key Insight: The drydock is not a maintenance event, it is an investment cycle. Operators who systematically use this window for hardware upgrades accumulate efficiency advantages that operational measures alone cannot achieve.
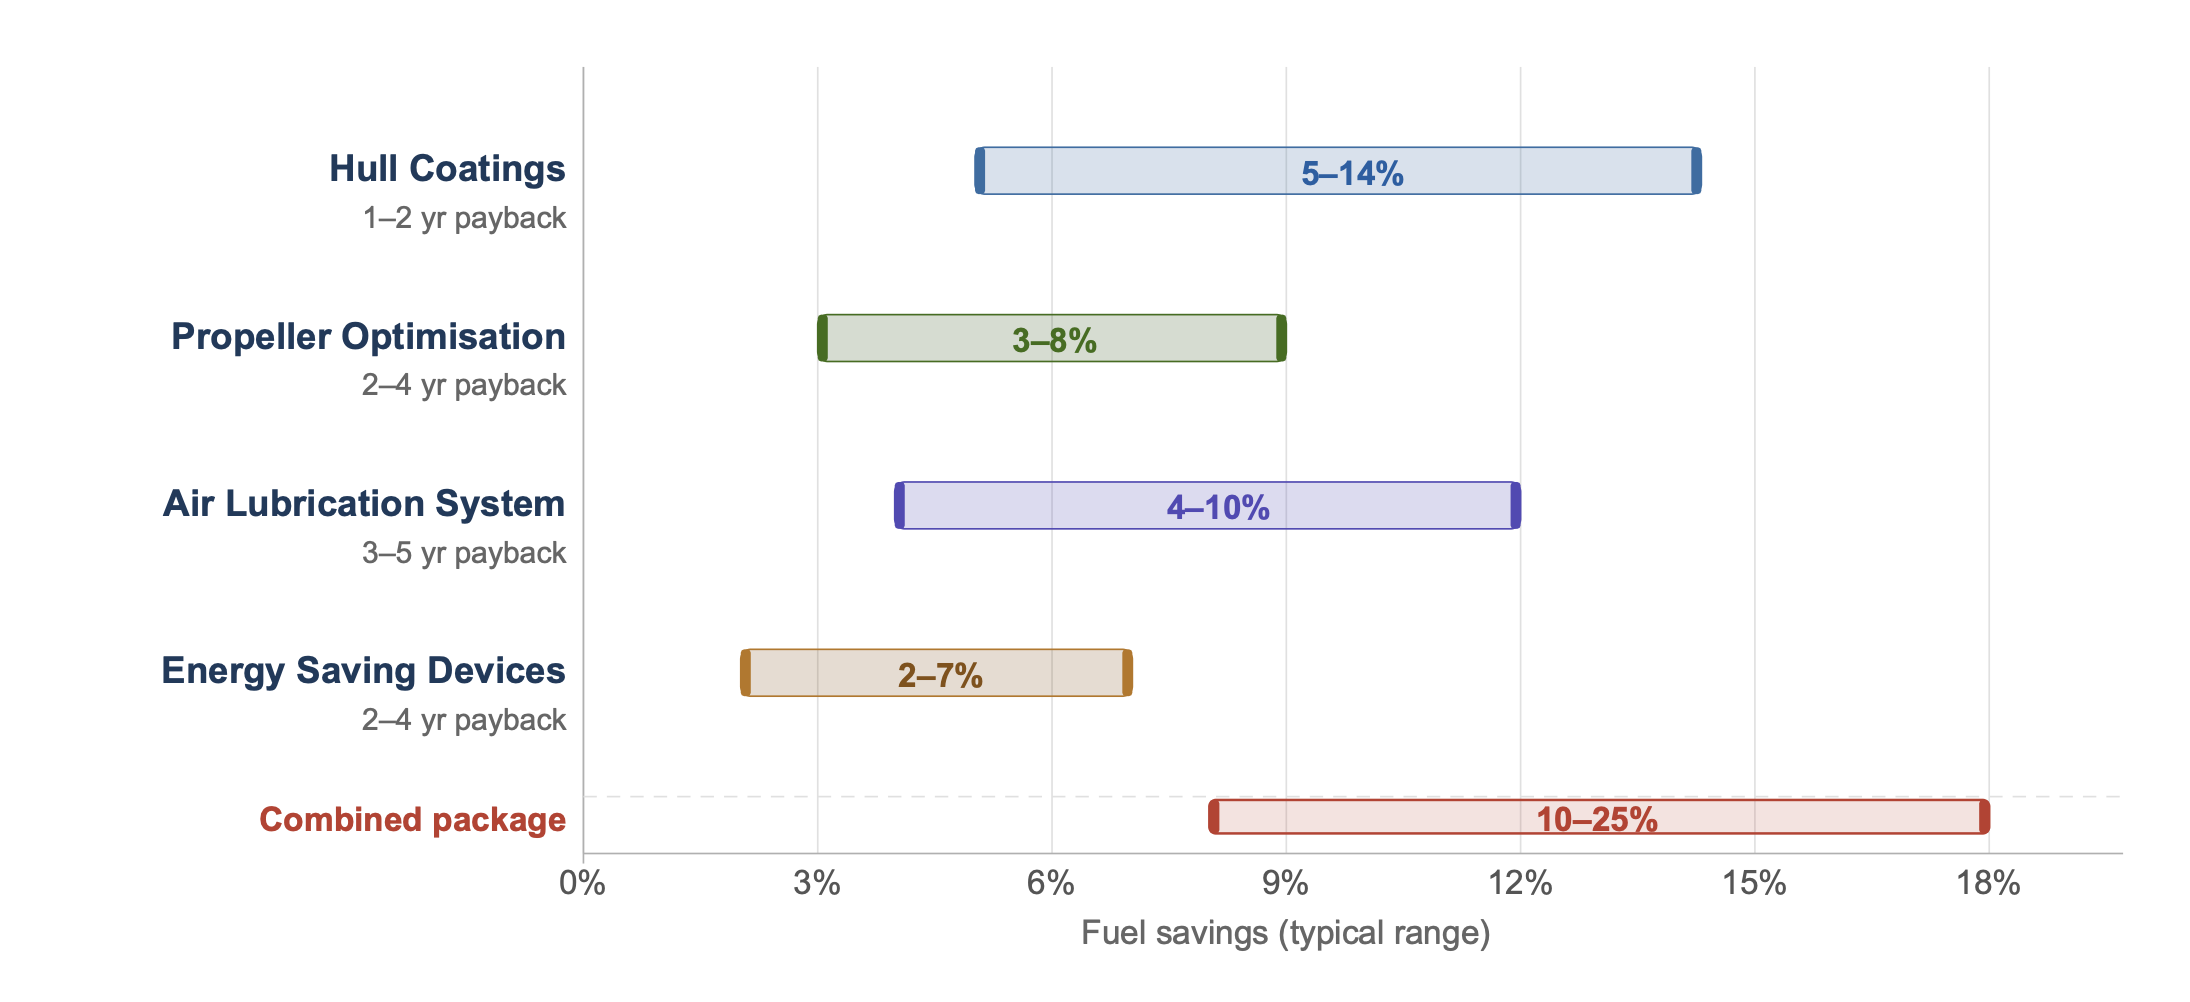
Figure 1: Fuel savings potential and typical payback, Drydock hardware retrofits at a glance
2. Hull Coatings: The Biggest Single Lever
Frictional resistance accounts for 50 to 70% of a vessel's total resistance. No other single system carries greater savings potential, and no other is simpler to address.
Third-generation high-performance antifouling systems, biocide-free foul release coatings based on silicone or hydrogel technology, reduce frictional resistance structurally, not merely in the weeks immediately after application. Nippon Paint Marine's FASTAR and AQUATERRAS, Hempel's Hempaguard, and AkzoNobel's SIGMAGLIDE achieve documented savings of 5 to 14% against conventional antifoulings in independent sea trials (IMO GreenVoyage2050, 2025; manufacturer data verified by DNV). The critical difference: these systems maintain their performance substantially longer after immersion than biocide-based products, reducing the frequency of underwater cleanings and thus lowering OPEX.
The prerequisite is uncompromising surface preparation: abrasive blasting to Sa 2.5 per ISO 8501-1 and careful application process control. A poor substrate destroys the benefit of any advanced topcoat. The drydock visit is therefore not only a matter of technology selection, but of process quality. Cutting corners on preparation is cutting corners on return.
👉 Key Insight: Hull coatings are the most cost-effective single measure in drydock, with the broadest impact of any available technology. For tankers and bulk carriers operating in tropical or temperate waters, the transition to biocide-free systems is strategically sound and regulatorily future-proof.
3. Propeller and ESDs: Precision at the Stern
Fouling and cavitation cost 5 to 15% of propeller efficiency, without the bridge ever noticing. Polishing rarely suffices. Redesign almost always pays.
Propeller fouling is insidious: a propeller that was 3% more efficient in the first year after docking loses that advantage within 12 to 18 months without regular cleaning. In drydock, three escalation levels are available: first, polishing to surface roughness values below Ra 3 µm, delivering 1 to 3% savings; second, pitch adjustment to the current operating profile (vessel deployment often changes substantially over a lifetime); third, full redesign to a high-efficiency propeller with optimised blade geometry, achieving savings of 4 to 8% on main engine consumption (Wärtsilä, 2025; Berg Propulsion, 2024).
Energy Saving Devices (ESDs) act as complements: pre-swirl fins ahead of the propeller homogenise the inflow; post-swirl rudder systems such as Becker's Mewis Duct or VICUSdt's Twisted Fin harvest the rotational energy from the propeller wash. Combined with an optimised propeller, an additional 2 to 7% is realistically achievable, and documented. Joint installation in a single docking is substantially more cost-effective than separate projects, as ESD positioning must be precisely calibrated to the specific propeller geometry.
👉 Key Insight: Propeller optimisation and ESDs are a technical unit. Polishing alone captures a third of the available potential. Combining redesign and ESDs in the same docking maximises impact at marginal additional cost.
4. Air Lubrication: Physics as a Cost Measure
Air bubbles beneath the hull sound like a trick. They are engineering, with verified net savings of 4 to 10% and a growing installation base on large commercial vessels worldwide.
Air Lubrication Systems (ALS) generate a layer of micro-bubbles beneath the flat bottom section of a vessel, partially interrupting the contact between steel and water and thereby significantly reducing frictional resistance. Silverstream Technologies, Damen ACES and Mitsubishi Heavy Industries MALS are the leading systems; their effectiveness has been confirmed in independent sea trials supervised by DNV and Lloyd's Register. Net savings, after accounting for compressor energy consumption, range from 4 to 10%, depending on vessel type and operating profile. Flat-bottomed vessels such as RoRo ferries and certain tanker types benefit disproportionately.
Drydock installation covers air distribution boxes in the hull, piping systems and compressors. The space requirement is moderate; system integration into energy management is now automatable through digital control units. Over 80 vessels worldwide already operate Silverstream systems; Damen has deployed ACES on several ferry classes and documents a mean fuel reduction of 5 to 7% (Silverstream Technologies, 2025; Damen Shipyards, 2024).
👉 Key Insight: Air lubrication is the technically most compelling complement to the coating-propeller package for flat-bottomed vessels. A payback of 3 to 5 years is solid, and is systematically shortened by CO₂ costs under EU ETS, as ALS directly reduces emissions intensity.
5. The Combination Calculus: What Actually Makes Financial Sense?
Single measures deliver savings. Combinations deliver compliance, and competitive advantage. The question is not which technology is best, but which package delivers the highest ROI for which vessel type.
A complete retrofit package in drydock, high-performance coating, propeller redesign with ESD installation, and air lubrication, can deliver 10 to 25% fuel savings across the full docking cycle. Total investment typically ranges from USD 500,000 to 2.5 million, depending on vessel size and system complexity. The business case incorporates four factors: bunker price (currently USD 550 to 650 per tonne VLSFO), CO₂ costs under EU ETS (forecast EUR 60 to 80 per tonne CO₂ for 2026 to 2028), CII rating improvement (direct impact on charter rates), and reduction of FuelEU Maritime penalty exposure (EUR 2,400 per tonne of deficit equivalent).
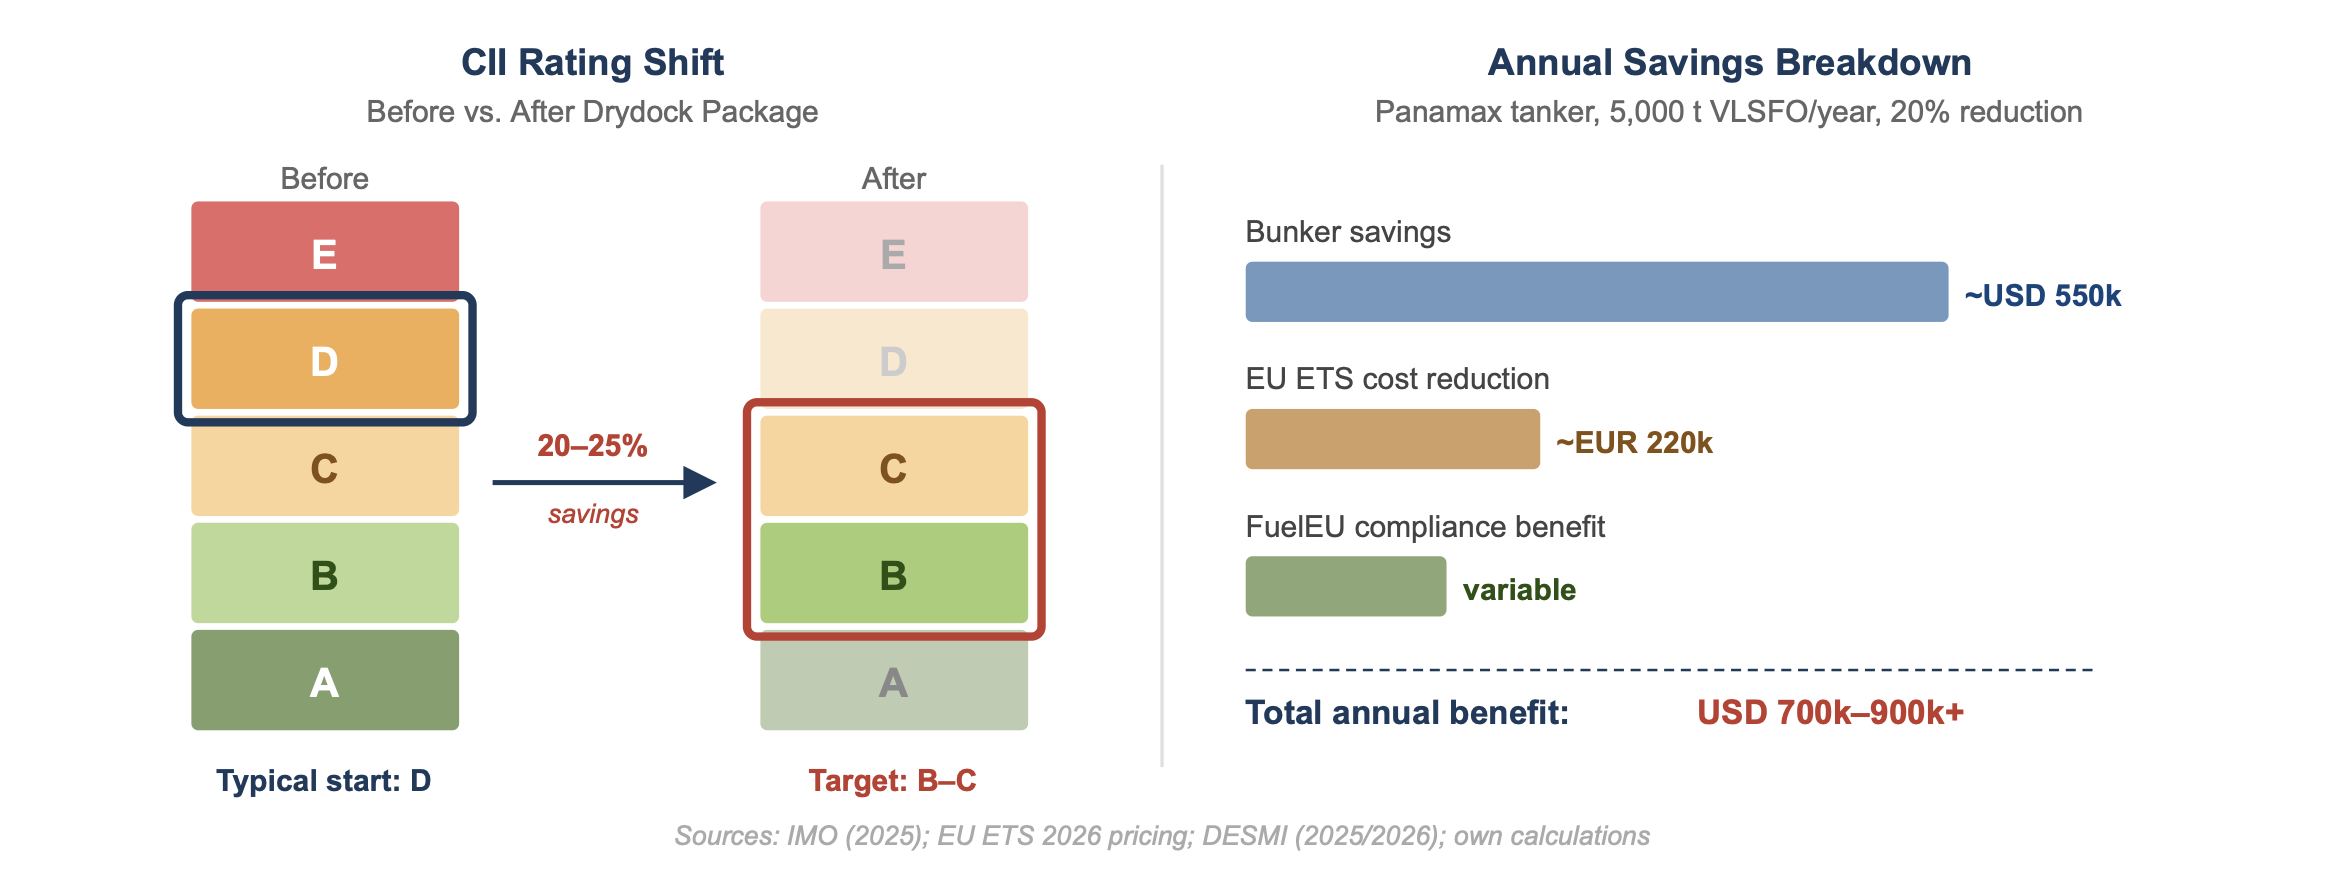
Compliance impact of the combined drydock package — CII rating shift and annual EU ETS savings (example: Panamax tanker, 5,000 t VLSFO/year)
Critical to profitability is vessel-specific analysis. CFD simulations allow forward-looking modelling of savings before a single tender is issued. DNV, Lloyd's Register and Bureau Veritas offer advisory services in this area; the cost of a pre-docking study typically ranges from USD 15,000 to 40,000 per vessel, a fraction of the potential investment, and a decisive filter against misallocation.
👉 Key Insight: The combination calculus is more favourable than the individual calculus. Coordinating coating, propeller, ESDs and air lubrication in a single docking saves not only fuel, it saves CAPEX, as mobilisation costs and class inspection are incurred only once.
Action Recommendations
Immediate Measures, This Week
Identify the next scheduled drydock date and enter it into the investment calendar: how many months remain for planning? A complete retrofit package requires 9 to 18 months of lead time for engineering, tendering and material procurement.
Review current coating performance: when was the last abrasive blasting? How many underwater cleanings have been carried out since the last docking? These data provide the baseline for ROI calculation.
Analyse the CII history of the fleet: which vessels have the largest efficiency gaps and would benefit most from hardware upgrades? Prioritisation should follow regulatory risk and payback potential.
Strategic Commitments, 6 to 24 Months
Commission CFD studies for priority vessels: USD 15,000 to 40,000 per vessel to model savings and ROI before docking. No investment decision without a data foundation.
Introduce high-performance coatings on all vessels docking within the next 24 months: select biocide-free systems for regulatory future-proofing; set Sa 2.5 as minimum blasting standard.
Combine propeller redesign with an ESD package: joint installation in the same docking is more cost-effective than separate projects; align budgets and engineering timelines early.
Evaluate air lubrication for flat-bottomed vessels (RoRo, tankers): pilot installation on one suitable vessel as a data foundation for a fleet-level decision.
Synchronise the drydock strategy with SEEMP Part III: all hardware measures must be documented as concrete, measurable actions in the SEEMP plan for 2026–2028, as evidence for the flag state and EU authorities.
Final Thought
Part I of this series established that efficiency is the primary decarbonisation lever. Part II shows where that lever is applied: hull, propeller, auxiliary systems, at the next drydock. The obstacle is not technological. The technologies exist, are proven, and are economically sound. The obstacle is a management culture that treats the drydock as an interruption rather than a strategic investment window. Vessels that dock to the minimum today will operate in 2028 with a CII rating that costs them charter partners, not because regulation is unfair, but because the decision could have been made long ago.
Which technology has the greatest impact on the efficiency of your fleet, and on what basis do you make investment decisions in drydock? Join the discussion or read Part III of this series: digital optimisation and predictive maintenance as the bridge between two docking cycles.
References
AkzoNobel / International Paint (2025) SIGMAGLIDE Product Performance Data: Foul Release Coating Efficiency. Amsterdam: AkzoNobel N.V.
Becker Marine Systems (2024) Mewis Duct and Twisted Fin: Energy Saving Device Performance Report. Hamburg: Becker Marine Systems GmbH.
Berg Propulsion (2024) Propeller Design and Retrofit Solutions: Efficiency Gains in Commercial Shipping. Gothenburg: Berg Propulsion AB.
Bureau Veritas (2025) Drydock Energy Efficiency Retrofit Guidelines: Verification and Certification Framework. Neuilly-sur-Seine: Bureau Veritas Marine & Offshore.
Damen Shipyards (2024) ACES Air Cavity and Lubrication System: Performance Validation Report. Gorinchem: Damen Shipyards Group.
DNV (2025) Maritime Forecast to 2050: Energy Transition Outlook. Høvik: DNV AS. Available at: dnv.com (Accessed: March 2026).
Hempel A/S (2025) Hempaguard X7: Biocide-Free Antifouling Performance Data 2024–2025. Kgs. Lyngby: Hempel A/S.
IMO GreenVoyage2050 (2025) Energy Efficiency Technologies: Verified Savings Data from Sea Trial Reports. London: International Maritime Organization.
Mitsubishi Heavy Industries (2024) MALS Air Lubrication System: Fleet Performance Summary. Tokyo: Mitsubishi Heavy Industries Marine Machinery & Equipment.
Nippon Paint Marine (2025) FASTAR and AQUATERRAS: Foul Release and Hydrogel Coating Performance Documentation. Tokyo: Nippon Paint Marine Coatings Co., Ltd.
Silverstream Technologies (2025) Air Lubrication System: Commercial Fleet Data and Verified Fuel Savings. London: Silverstream Technologies Ltd.
VICUSdt (2024) Energy Saving Device Portfolio: Pre-Swirl and Post-Swirl Solutions for Retrofit Applications. Madrid: VICUSdt S.L.
Wärtsilä (2025) Propeller Retrofit and Optimisation Services: Efficiency Gains and ROI Analysis. Helsinki: Wärtsilä Corporation.